Visualizing Data in Excel: A Comprehensive Guide
Explore the diverse data visualization possibilities in Excel that aid in analyzing and interpreting your data effectively.
Introduction
Welcome to our comprehensive guide on visualizing data in Excel. In this article, we will delve into the world of data visualization and provide you with valuable insights on how to create compelling visual representations of your data using Excel. Whether you are a beginner or an experienced Excel user, this guide will equip you with the knowledge and techniques to effectively communicate your data through visually appealing charts and graphs.
Why Data Visualization Matters

Data visualization is a powerful tool that enables us to make sense of complex datasets. It allows us to identify patterns, trends, and outliers that might not be immediately apparent in raw data. Visualizing data in Excel not only enhances our understanding of the information at hand but also enables us to communicate our findings to others in a clear and concise manner.
Getting Started with Excel Charts
- Selecting the Right Chart Type
Choosing the appropriate chart type is crucial for effectively representing your data. Excel offers a wide range of chart options, including bar charts, line charts, pie charts, scatter plots, and more. Consider the nature of your data and the message you want to convey when selecting the most suitable chart type. - Formatting and Customization
Excel provides extensive formatting and customization options to refine the appearance of your charts. From adjusting axis labels to modifying colors and styles, these features allow you to create visually appealing charts that align with your brand or presentation requirements. - Adding Data Labels and Annotations
To enhance the clarity of your visualizations, Excel enables you to add data labels and annotations. These labels provide additional context and make it easier for your audience to interpret the information being presented. You can include axis labels, data point labels, and explanatory text to further enrich your charts.
Advanced-Data Visualization Techniques
- Creating PivotCharts
PivotCharts are a powerful feature in Excel that allows you to visualize data from pivot tables. By summarizing and aggregating data, pivot tables provide a comprehensive overview that can be transformed into dynamic and interactive charts. Utilizing PivotCharts enables you to explore and analyze complex datasets with ease. - Utilizing Advanced Charting Features
Excel offers advanced charting features that can take your visualizations to the next level. From trendlines and error bars to 3D charts and sparklines, these tools allow you to add depth and sophistication to your data representations. Experimenting with these features can help you create visually striking charts that captivate your audience.
Best Practices for Effective Data Visualization
To ensure your data visualizations have maximum impact, keep the following best practices in mind:
- Simplify and Declutter
Avoid cluttering your charts with excessive information or unnecessary embellishments. Focus on the key message you want to convey and remove any elements that distract from that message. Remember, simplicity is key when it comes to effective data visualization. - Use Color Strategically
Colors can evoke emotions and draw attention to specific areas of your charts. Use color strategically to highlight important data points or to group related information. However, be mindful of accessibility considerations and ensure that your color choices are accessible to individuals with color vision deficiencies. - Tell a Story with Your Data
Data visualization is not just about presenting numbers; it’s about telling a story. Structure your visualizations in a way that guides your audience through a narrative. Start with an introduction, present the main findings, and conclude with a clear takeaway or call to action.
Conclusion
In conclusion, mastering the art of visualizing data in Excel can significantly enhance your ability to analyze and communicate complex information. By selecting the right chart types, utilizing advanced techniques, and following best practices, you can create visually compelling representations that effectively convey your data’s story. We hope this comprehensive guide has provided you with the knowledge and inspiration to create outstanding data visualizations in Excel. Start exploring the power of data visualization today and unlock new insights from your data.
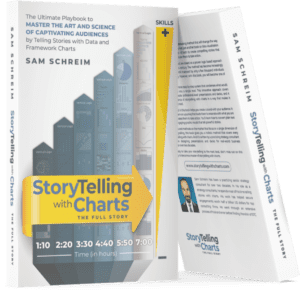
Check StoryTelling with Charts – The Full Story


