How to Generate Professional Pie Charts in Minutes with our Graph Maker
Have you ever scratched your head, wrestling with the challenge of turning complex data into a digestible format? You’re not…
Read More
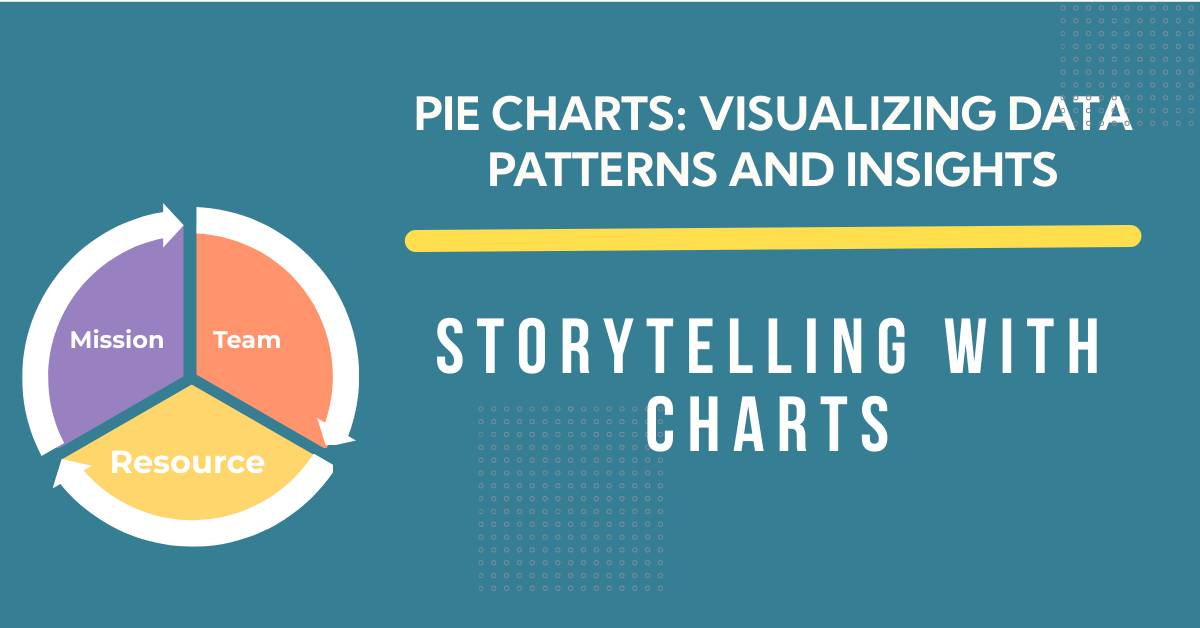
Pie Charts: Visualizing Data Patterns and Insights
Have you ever struggled to understand complex data or make comparisons swiftly? Consider the humble pie chart, a powerful tool…
Read More
Narrative Weaving for Boosting Social Media Interaction: The Art of Data Storytelling
Social media is overflowing with noise these days. From tweet bombardments to endless Instagram scrolling, folks are overwhelmed and overstimulated.…
Read More
The Future of Data Storytelling
Data storytelling today stands at a pivotal juncture, ripe with possibility. Though current practices enlighten many, rapidly evolving technologies promise…
Read More
Data as a Story: How to Use Symbolism, Personification, and Simile to Engage Your Audience
Imagine yourself about to present important data. Do you simply open your laptop and rattle off metrics? Or do you…
Read More
How to Wow Your Audience with Data: Tips and Tricks for Using Hyperbole, Alliteration, and Imagery in Your Presentations
You’re about to showcase important data to an audience. Do you simply open PowerPoint and read bullet points verbatim? Or…
Read More
Choosing the Right Chart or Graph for Your Data: A Comprehensive Guide
Data is everywhere. We use it to make decisions, communicate, to persuade, and to learn. But data alone is not…
Read More
Visualizing Data in Excel: A Comprehensive Guide
Explore the diverse data visualization possibilities in Excel that aid in analyzing and interpreting your data effectively. Introduction Welcome to…
Read More
7 Tips to Master Visual Storytelling and Outrank Your Competition
Introduction Welcome to our comprehensive guide on mastering visual storytelling. In today’s digital age, capturing the attention of your audience…
Read More

