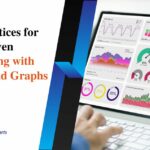
Data Storytelling Best Practices: 5 Techniques for Engaging Data Using Data Points
Data is everywhere today – from websites tracking user behaviour to sensors collecting information in manufacturing plants. Making sense of this data deluge is critical for businesses to gain actionable insights. This is where data storytelling comes in.
Data storytelling best practices involve using data visualizations, narratives, and other techniques to turn complex data sets into compelling stories that drive business decisions. In this blog, we’ll discuss in depth five data storytelling best practices.
Importance of Data Storytelling Best Practices
With increasing data volumes, telling impactful data stories is an essential skill. However, crafting data narratives is an art that requires creativity combined with analytical rigour. Without care, it is easy to misrepresent data or draw inaccurate conclusions, leading to bad decisions.
Having robust data storytelling practices allows you to tap into data’s true potential while maintaining integrity. It enables data democratization in your organization, lets you discover powerful insights, and aids data-driven transformation.
5 Techniques for Engaging Data
Here are five data storytelling best practices to adopt for engaging data:
1. Simplify Complex Data

Simplifying things is where the data storytelling magic happens. We can showcase the essential data insights that matter most by eliminating clutter, focusing on visualizations, and using summaries and segmentation. Some ways to simply messy, granular data are:
- Eliminate clutter by removing redundant and insignificant variables
- Use aggregation to summarize data into main trends and patterns
- Focus visualization on the most meaningful relationships and findings
- Use summaries, clustering, segmentation and drill-downs to showcase essentials
2. Use Visuals Purposefully
Eye-catching data visualizations might seem like an obvious way to engage people, but restraint is key. The right visuals should direct attention to support the core story rather than overwhelm. Visuals allow faster processing of insights. But using too many flashy charts can overwhelm readers. Strategic visuals should:
- Spotlight main story being told through aesthetics and placement
- Include only required and relevant graphical elements
- Use styles, colours and layouts to direct the audience attention
3. Narrate a Story
Crafting compelling data narratives is an art that brings numbers to life. By shaping raw statistics into an engaging storyline arc – with rising action, climactic revelations, and impactful conclusions – data translators can inform, surprise, and inspire change within their organizations. Use an easy-to-follow story arc when structuring your data narrative:
- Opening hook: Intriguing statement to capture attention
- Build context: Provide background details to aid understanding
- Rising action: Surface patterns in data using visualizations and commentary
- Climax: Reveal key discoveries and conclusions
- Closing: End by recapping main findings and next steps
4. Engage with Comparisons and Benchmarks
Impactful data storytelling brings numbers to life by connecting them to familiar frames of reference. Using comparative references helps anchor data insights. Useful techniques involve:
- Time-series analysis to showcase trends
- Cross-sectional analysis across different products, regions or categories
- External benchmarking against industry averages or best practices
- Target benchmarks versus strategic goals and operational metrics
5. Emphasize Key Takeaways
Great data storytelling should spotlight the most critical insights derived from thorough analysis. Data stories should highlight important meanings derived from analytics. Useful ways to accentuate key learnings are:
- Callout boxes to flag critical observations and recommendations
- Executive summary with main conclusions upfront
- Compelling headlines and summaries to reiterate main points
- Memorable data analogies and metaphors for recall
Conclusion
Data storytelling requires balancing art and science. While software creates attractive charts, the human touch adds nuance and significance. Using the right blend of visuals, narrative, and comparisons leads to resonant stories that drive change. With sound storytelling practices, data leaders can steer their organizations to new heights of innovation and progress through data-driven decision-making.