
Data AnalysisData CommunicationData StorytellingData Storytelling TechniquesData VisualizationData Visualization SoftwareHow Storytelling charts worksNarrative ChartsStorytelling with chartsStorytelling with DataVisual Storytelling
Using Data Narrative and Storytelling to Engage Your Audience
Storytelling is a powerful tool for making connections and relaying information. When woven into an engaging, purposeful narrative, data can…
Read More

Data AnalysisData CommunicationData StorytellingData Storytelling TechniquesData VisualizationData Visualization SoftwareHow Storytelling charts worksStorytelling with chartsStorytelling with DataVisual Storytelling
How to Improve Your Data Literacy Through Storytelling
Data and numbers can often feel dry and uninspiring. But when data is combined with storytelling, it comes alive in…
Read More

Data StorytellingData Storytelling TechniquesData VisualizationPie ChartsStorytelling with chartsStorytelling with DataVisual Storytelling
Taking Your Data Presentations to the Next Level with ‘Storytelling with Data
Data storytelling is about presenting data in a way that everyone can understand and turning it into a compelling narrative.
Read More

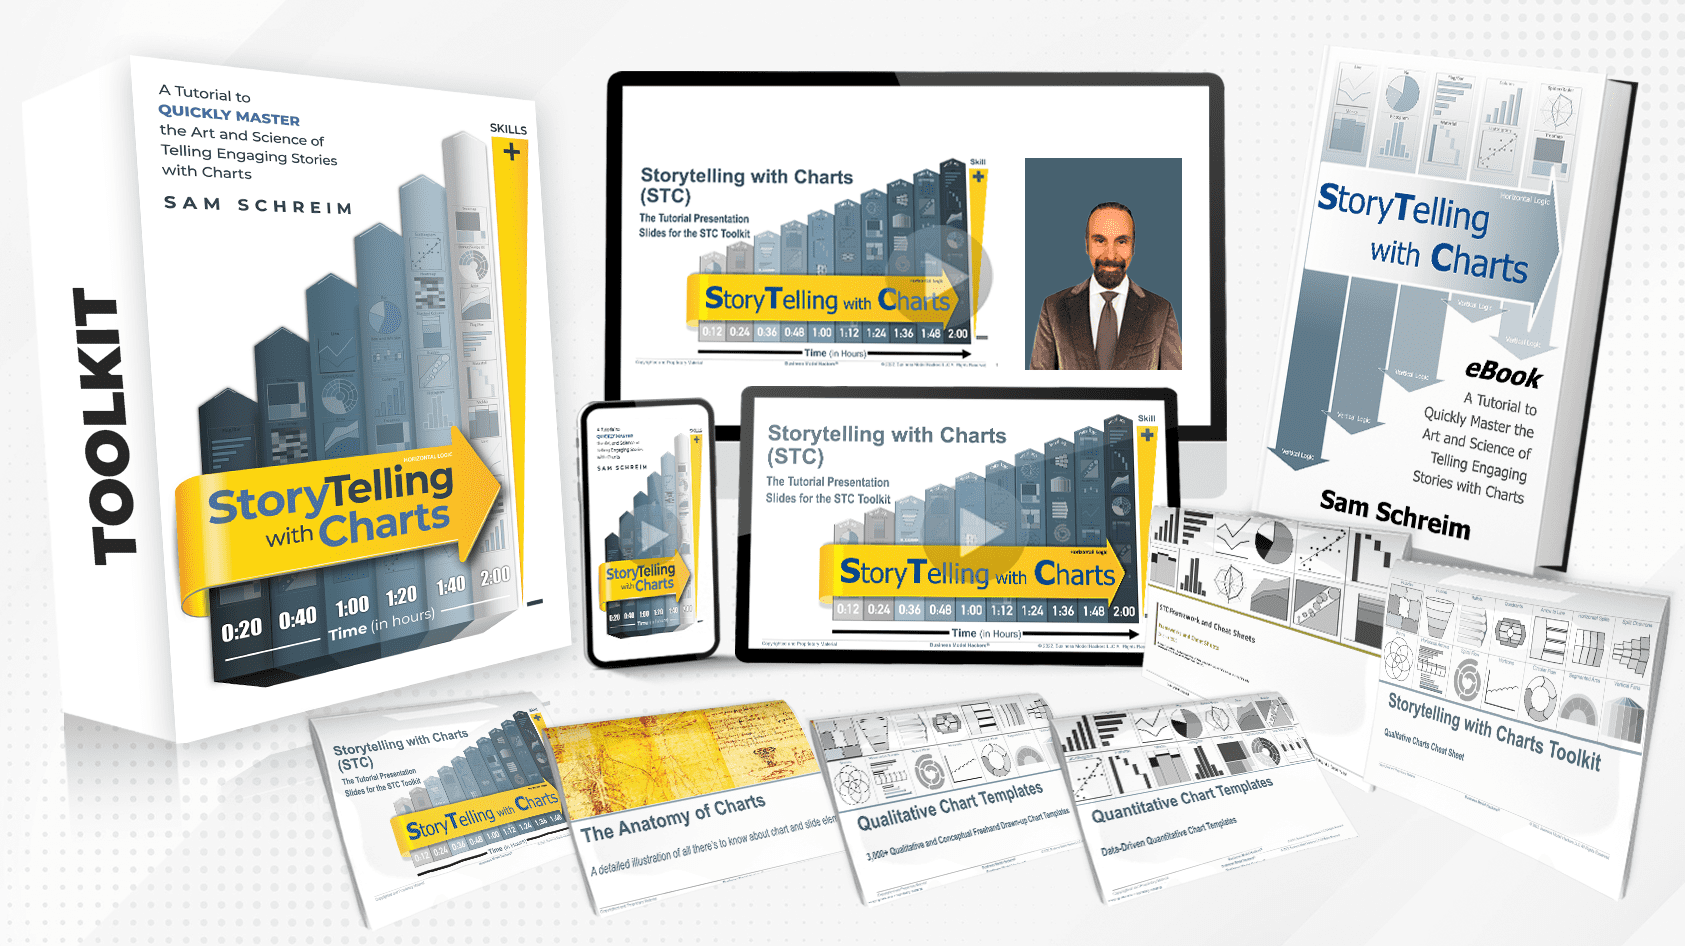
Data StorytellingData Storytelling TechniquesData VisualizationHow Storytelling charts worksSTC ToolkitStorytelling ToolsStorytelling with chartsStorytelling with DataVisual Storytelling
Discover the Secrets of Compelling Data Narratives with ‘Storytelling with Data
Have you ever found yourself drowning in a sea of data, unsure where to start? Ah, join the club. Here’s…
Read More
Data StorytellingData Storytelling TechniquesStorytelling ToolsStorytelling with chartsStorytelling with DataVisual Storytelling
Become a Data Storytelling Pro: Lessons from Sam Schreim’s Book
Ever found yourself squinting at a report cluttered with numbers, scratching your head over how to transform it into something…
Read More

Simplify Data Visualization with our Pie Chart Generator
Ever felt like you’re navigating a maze when trying to make sense of complex data? We’ve walked in those shoes…
Read More
Create Stunning Pie Charts with our Easy-to-Use Generator Tool
Are you tired of struggling to create professional-looking pie charts? Believe us, we’ve been there too. After exploring various options…
Read More
Pie Charts: Visualizing Data Patterns and Insights
Have you ever struggled to understand complex data or make comparisons swiftly? Consider the humble pie chart, a powerful tool…
Read More
Data StorytellingData Storytelling TechniquesData VisualizationStorytelling ToolsStorytelling with chartsVisual Storytelling
Enhancing Data Narratives: Incorporating Pie Charts in Visual Storytelling
Data can often feel overwhelming, making it a challenge to tell captivating stories. Did you know that pie charts, when…
Read More