Data StorytellingData Storytelling TechniquesData VisualizationHow Storytelling charts worksSTC ToolkitStorytelling ToolsStorytelling with chartsStorytelling with DataVisual Storytelling
Discover the Secrets of Compelling Data Narratives with ‘Storytelling with Data
Have you ever found yourself drowning in a sea of data, unsure where to start? Ah, join the club. Here’s…
Read More
Data StorytellingData Storytelling TechniquesStorytelling ToolsStorytelling with chartsStorytelling with DataVisual Storytelling
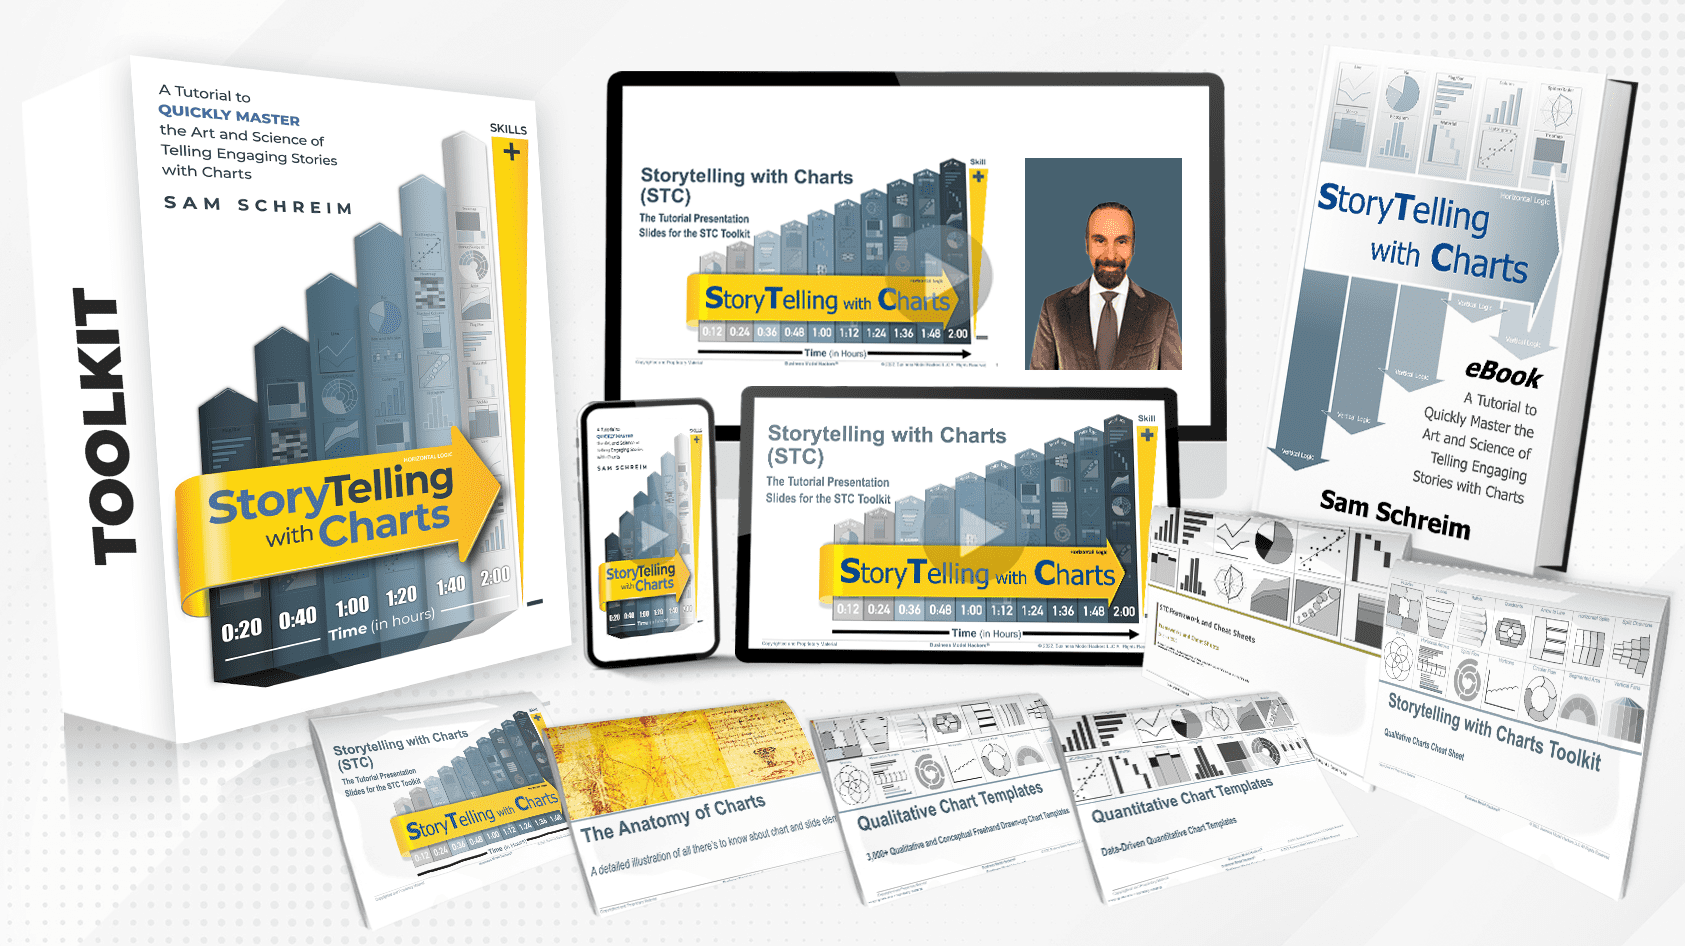
Become a Data Storytelling Pro: Lessons from Sam Schreim’s Book
Ever found yourself squinting at a report cluttered with numbers, scratching your head over how to transform it into something…
Read More
How to Generate Professional Pie Charts in Minutes with our Graph Maker
Have you ever scratched your head, wrestling with the challenge of turning complex data into a digestible format? You’re not…
Read More
Create Stunning Pie Charts with our Easy-to-Use Generator Tool
Are you tired of struggling to create professional-looking pie charts? Believe us, we’ve been there too. After exploring various options…
Read More
Data StorytellingData Storytelling TechniquesData VisualizationStorytelling ToolsStorytelling with chartsVisual Storytelling
Enhancing Data Narratives: Incorporating Pie Charts in Visual Storytelling
Data can often feel overwhelming, making it a challenge to tell captivating stories. Did you know that pie charts, when…
Read More
Creating Compelling Visuals: Pie Charts for Effective Data Storytelling
Grasping the essence of complex data can be a daunting task. Did you know that pie charts are powerful visual…
Read More
Crafting Compelling Narratives with Data in Project Management: Unveiling the Power of Storytelling
Uh oh, your audience is nodding off as you drone through endless charts and metrics for the weekly project update.…
Read More
The Power of Storytelling: Differentiate, Connect, and Influence
In today’s digital age, where attention spans are fleeting and competition is fierce, businesses strive to capture the hearts and…
Read More
Data AnalysisData Storytelling TechniquesData VisualizationSTC ToolkitStorytelling with chartsStorytelling with Data
The Importance of Storytelling with Data
Data alone is often not enough to convey complex information in a way that truly resonates with an audience. That’s…
Read More


