Foresight is 20/20: Data Prediction Through Visualization
The ability to analyze data and identify patterns that allow us to make reasonable predictions about the future is an…
Read More
Big Data Visualization: 4 Techniques to Use in 2024
Big data visualization has become a critical technique to analyze and visualize large data sets. The advent of big data…
Read More
Dashboards: Making Sense of Complex Data for Business Leaders
In today’s data-rich business environment, executives often need help to stay on top of the sheer volume of metrics from…
Read More
Choosing the Right Visual Display for Your Data Insights
Data visualization empowers us to see and understand patterns that live within the data. However, choosing the optimal graph or…
Read More
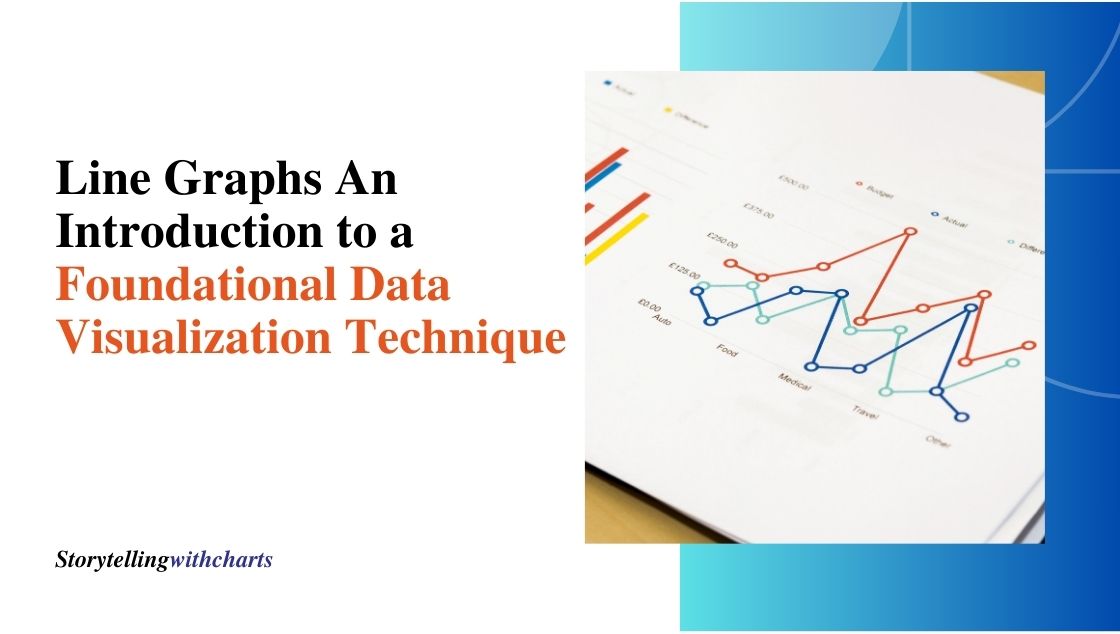
Line Graphs: An Introduction to a Foundational Data Visualization Technique
A line graph, also known as a line chart, is one of the most universal and intuitive types of charts…
Read More
Linear Trendline Techniques: How to Reveal Hidden Patterns in Your Data
Understanding patterns and linear trendlines in data is crucial for businesses to optimize operations and make informed decisions. However, with…
Read More
Data AnalysisData CommunicationData StorytellingData Storytelling TechniquesData VisualizationData Visualization SoftwareHow Storytelling charts worksStorytelling with chartsStorytelling with DataVisual Storytelling
A Step-by-Step Guide to Creating Effective Scatter Plots
A scatter plot, also known as a scatter graph, is a type of graph that uses Cartesian coordinates to display…
Read More
Data AnalysisData CommunicationData StorytellingData Storytelling TechniquesData VisualizationData Visualization SoftwareHow Storytelling charts worksNarrative ChartsPie ChartsStorytelling with chartsStorytelling with DataVisual Storytelling
Data Comparison Chart: How To Visually Present Similarities and Differences
Effectively highlighting similarities and differences is crucial for insightful data analysis. Data comparison charts provide simplified and authoritative visual formats…
Read More
Data AnalysisData CommunicationData StorytellingData Storytelling TechniquesData VisualizationData Visualization SoftwareHow Storytelling charts worksStorytelling with chartsStorytelling with DataVisual Storytelling
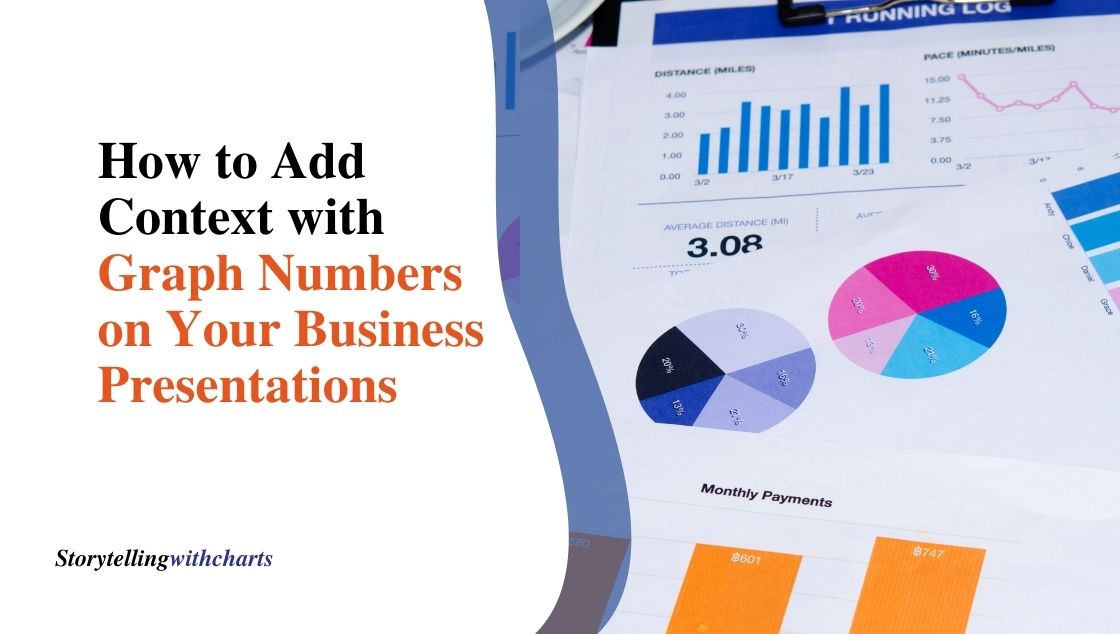
How to Add Context with Graph Numbers on Your Business Presentations
A key part of any effective business presentation is visualizing data that communicates insights. However, graphs and charts need context…
Read More

