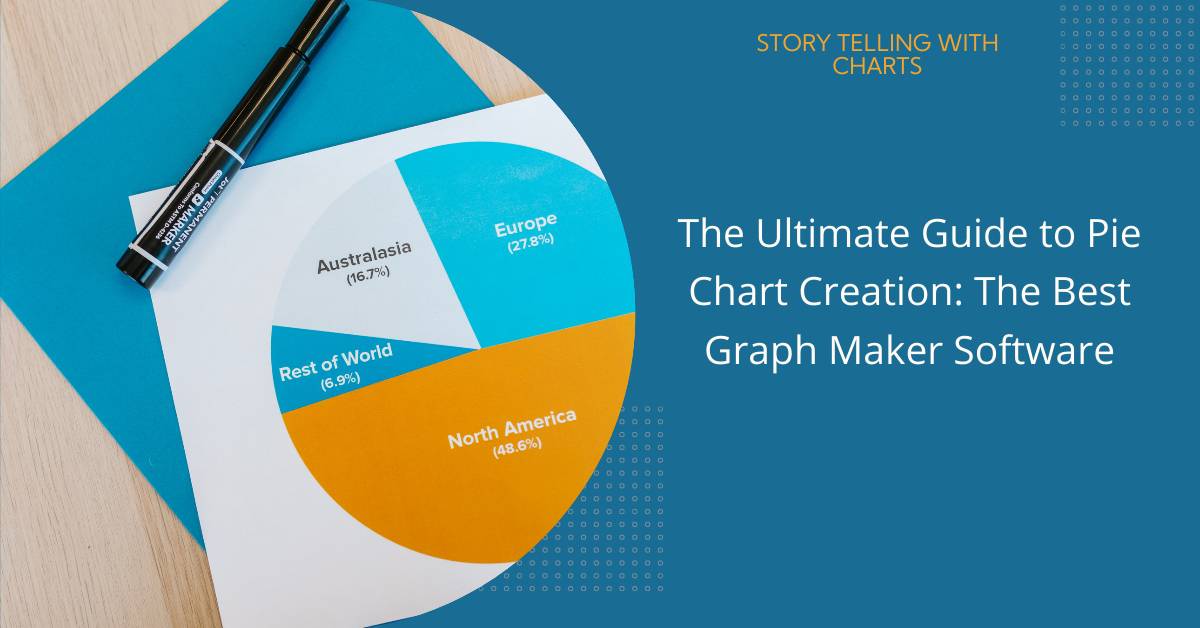
Utilizing Pie Charts: Best Practices for Educational Presentations
Pie charts are a simple yet effective way to represent proportional data in educational settings. By breaking down a whole…
Read More
Should You Use a Bar Graph or Choose Another Chart Type?
With endless options for visually displaying data, determining the optimal chart type can be paralyzing. But while flashy graphics dazzle,…
Read More
Interpreting Scatter Plots and Assessing Variable Relationships
When analyzing data, it’s important to determine how different variables are related to each other. This can provide valuable insights…
Read More
An Overview of Common Line Chart Types and When to Use Them
In the busy world of finance and investing, the ability to interpret market movements and trends through data visualization is…
Read More
How to Construct Line Plots for Easy Data Interpretation
A line plot is a very handy graph to see how numbers change over time. In this type of graph,…
Read More
Data AnalysisData CommunicationData StorytellingData Storytelling TechniquesData VisualizationData Visualization SoftwareHow Storytelling charts worksNarrative ChartsPie ChartsStorytelling with chartsStorytelling with DataVisual Storytelling
Data Comparison Chart: How To Visually Present Similarities and Differences
Effectively highlighting similarities and differences is crucial for insightful data analysis. Data comparison charts provide simplified and authoritative visual formats…
Read More
Data AnalysisData CommunicationData StorytellingData Storytelling TechniquesData Visualization SoftwareHow Storytelling charts worksPie ChartsStorytelling with chartsStorytelling with Data
A Quick Guide to Online Chart and Graph Makers for Every Skill Level
Today, the ability to create charts and graphs effectively is not just a skill but a necessity for anyone dealing…
Read More
Data StorytellingData Storytelling TechniquesData VisualizationPie ChartsStorytelling with chartsStorytelling with DataVisual Storytelling
Taking Your Data Presentations to the Next Level with ‘Storytelling with Data
Data storytelling is about presenting data in a way that everyone can understand and turning it into a compelling narrative.
Read More
Simplify Data Visualization with our Pie Chart Generator
Ever felt like you’re navigating a maze when trying to make sense of complex data? We’ve walked in those shoes…
Read More

