Data AnalysisData CommunicationData StorytellingData Storytelling TechniquesData VisualizationData Visualization SoftwareHow Storytelling charts worksStorytelling with chartsStorytelling with Data
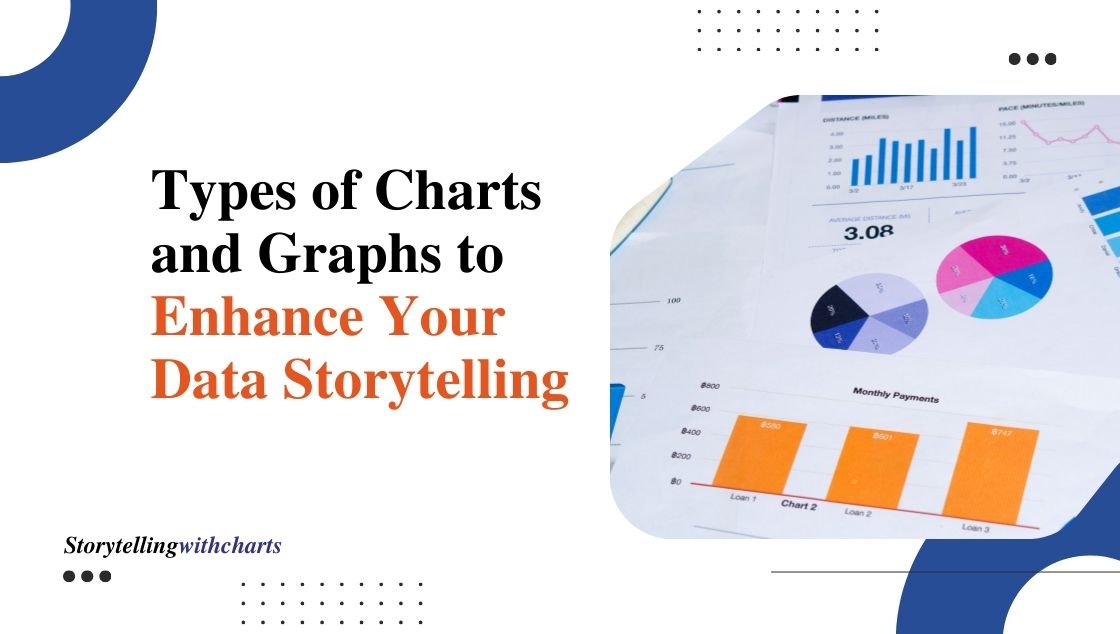
15 Types of Charts and Graphs to Enhance Your Data Storytelling
The big data market is heading toward $401.2 billion by 2028. If numbers scare you or bore you in an…
Read More
Data AnalysisData CommunicationData StorytellingData Storytelling TechniquesData VisualizationData Visualization SoftwareHow Storytelling charts works
How to Create Stunning Data Charts in Excel for Data Storytelling
Do your eyes automatically shut off every time you hear the words Excel and spreadsheets? But wait, we know the…
Read More
Data StorytellingData Storytelling TechniquesData VisualizationHow Storytelling charts worksSTC ToolkitStorytelling ToolsStorytelling with chartsStorytelling with DataVisual Storytelling
Discover the Secrets of Compelling Data Narratives with ‘Storytelling with Data
Have you ever found yourself drowning in a sea of data, unsure where to start? Ah, join the club. Here’s…
Read More
How Data Storytelling Drives Results
Facts and figures spell snoozeville for most folks. But cleverly crafted narratives transforming data into engaging stories? Now you captivated…
Read More
Choosing the Right Chart or Graph for Your Data: A Comprehensive Guide
Data is everywhere. We use it to make decisions, communicate, to persuade, and to learn. But data alone is not…
Read More
Storytelling with Charts: How to Communicate Quantitative Analysis Effectively
Have you ever felt like your data analysis was lost in translation? You spent hours crunching the numbers, finding the…
Read More
Visualizing Data in Excel: A Comprehensive Guide
Explore the diverse data visualization possibilities in Excel that aid in analyzing and interpreting your data effectively. Introduction Welcome to…
Read More
Data Storytelling TechniquesData VisualizationHow Storytelling charts worksSTC ToolkitStorytelling with chartsStorytelling with Data
How Storytelling with Data Works
Data analysis has become an essential part of businesses and organizations. It helps them to make informed decisions and identify…
Read More
Data VisualizationHow Storytelling charts worksNarrative ChartsSTC ToolkitStorytelling with chartsStorytelling with Data
Data Storytelling: Unleashing the Power of Visual Narratives
Introduction We understand the significance of data storytelling in today’s digital landscape. As businesses strive to engage and captivate their…
Read More

