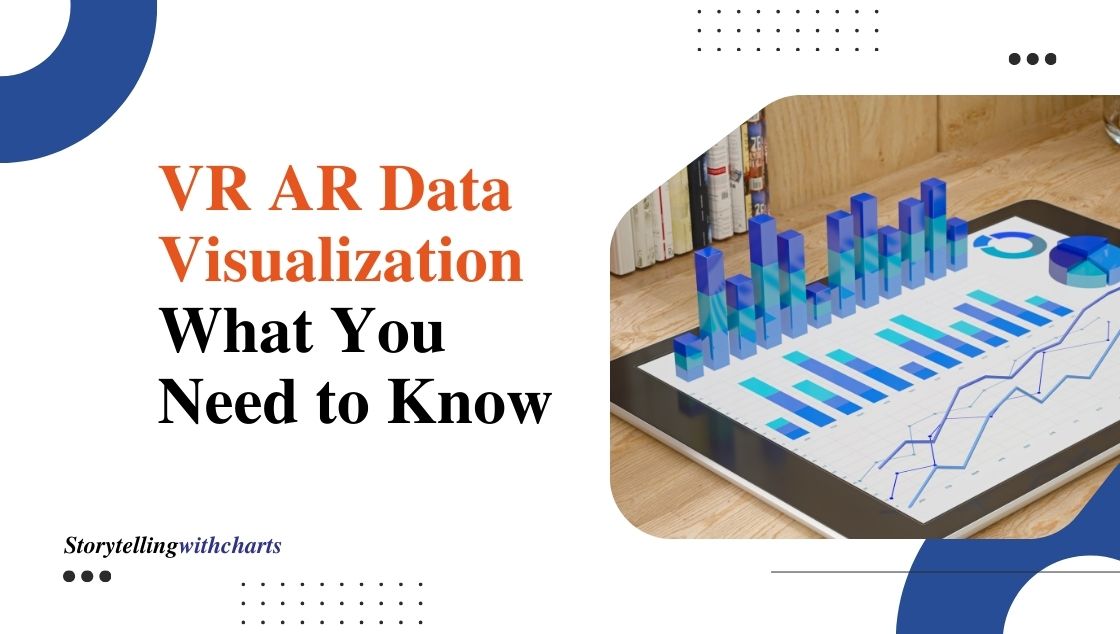
VR AR Data Visualization: What You Need to Know
The world of data visualization is going to new heights. Because the Web browsers allow access to a client’s GPU,…
Read More
AI In Data Visualization: An Overview Of Rising Trends And Traditional Tools
Did you know that there is over 80% information that is transmitted to our brain visually? It is no wonder…
Read More
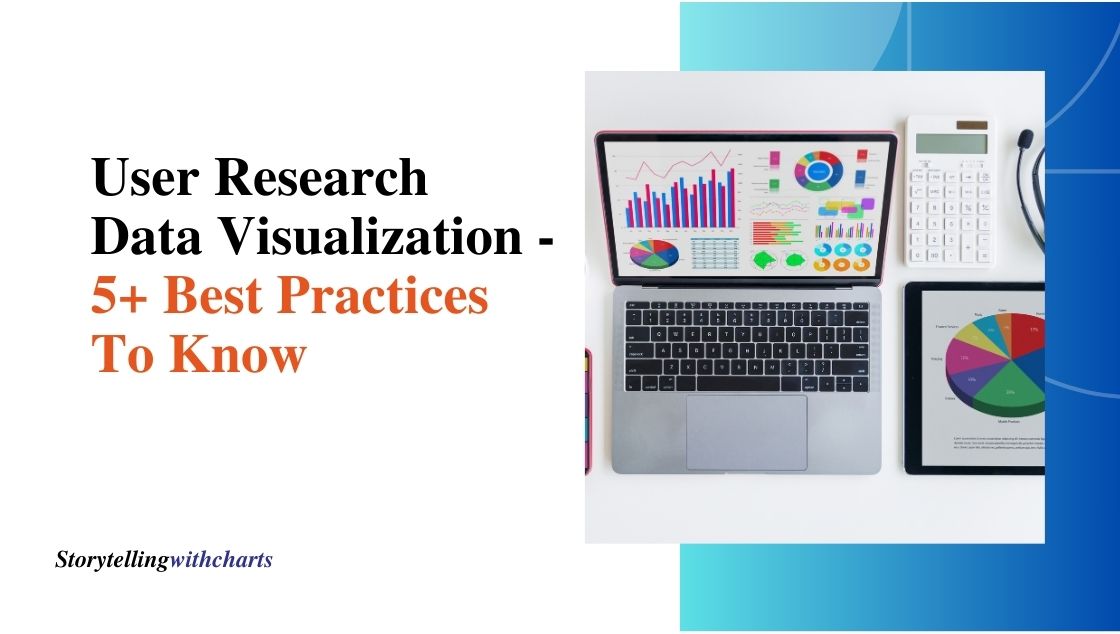
The Best Practices of ‘User Research Data Visualization’: Testing Visuals Before Release
Data visualization is basically the science and art of presenting data clearly, meaningfully, and engagingly. However, the big question here…
Read More
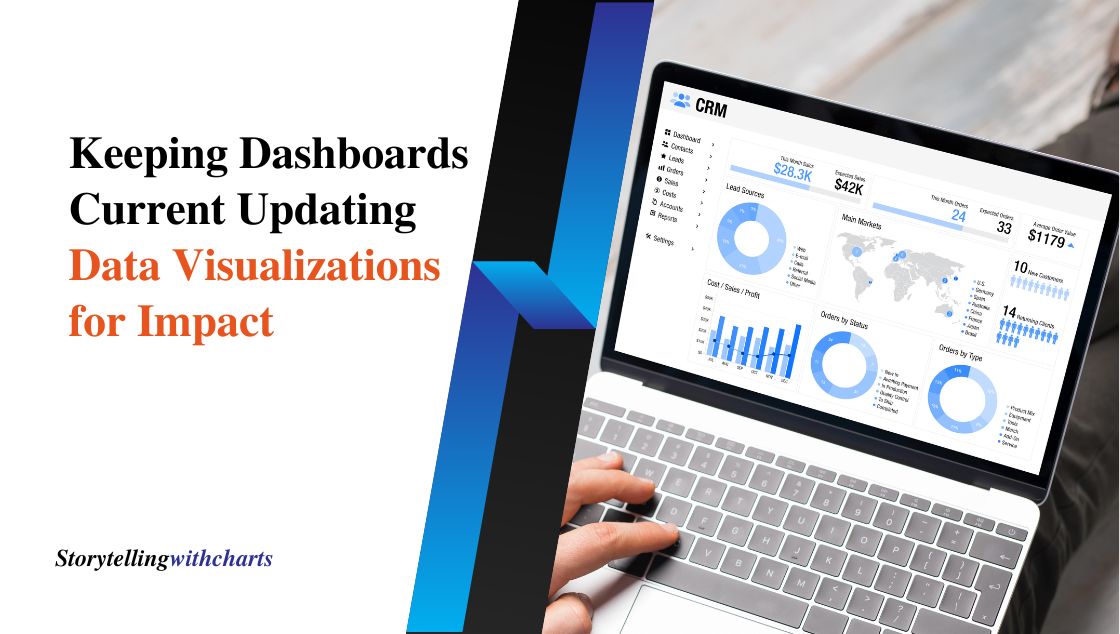
Keeping Dashboards Current: Updating Data Visualizations for Impact
In today’s fast-moving business environment, data quickly becomes stale. Yesterday’s reports and dashboards no longer reflect current realities. Companies that…
Read More
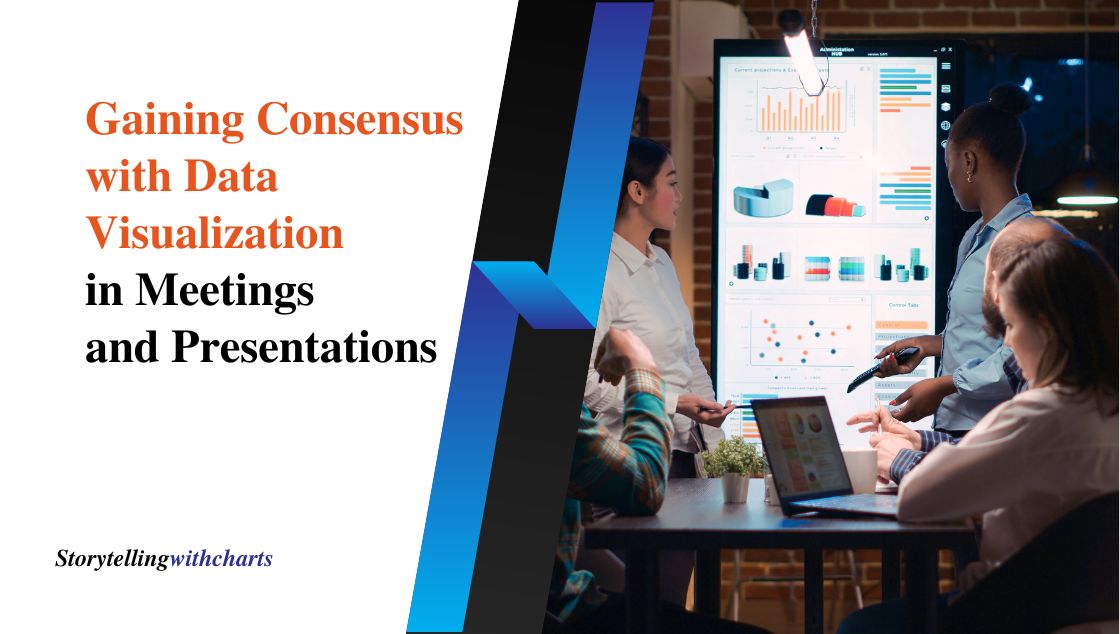
Gaining Consensus with Data Visualization in Meetings and Presentations
Meetings filled with endless data and statistics can glaze over people’s eyes. However, good data is meant to inform decisions…
Read More
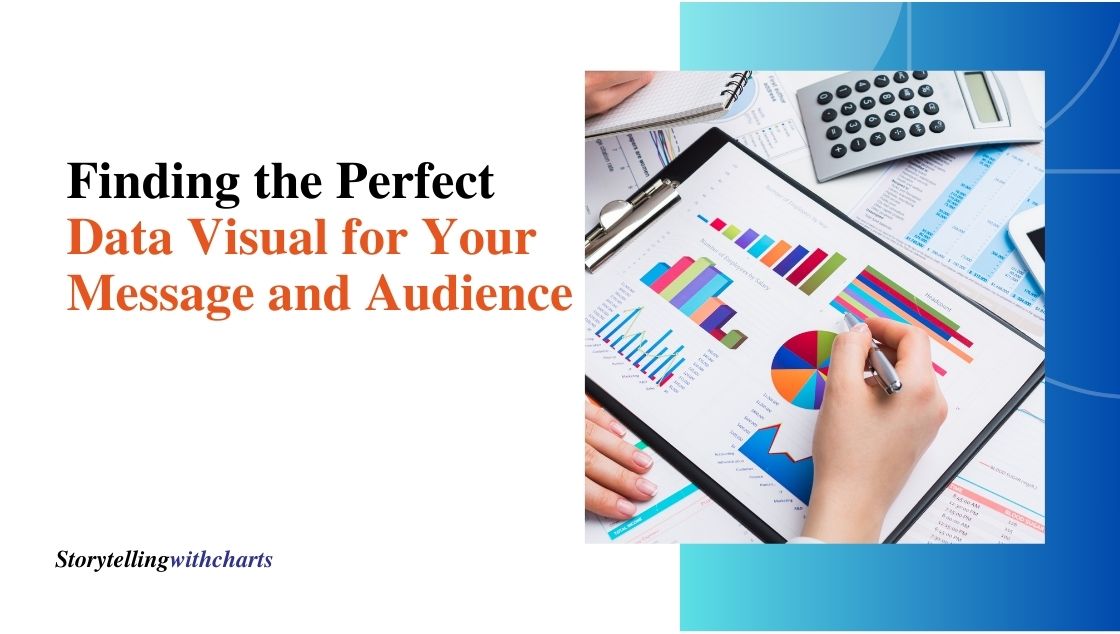
Finding the Perfect Data Visual for Your Message and Audience
Data visualization transforms dry, dense datasets into impactful stories that resonate. However, choosing ineffective graphics wastes opportunities to enlighten and…
Read More
Data AnalysisData CommunicationData StorytellingData Storytelling TechniquesData VisualizationData Visualization SoftwareHow Storytelling charts worksStorytelling with chartsStorytelling with DataVisual Storytelling
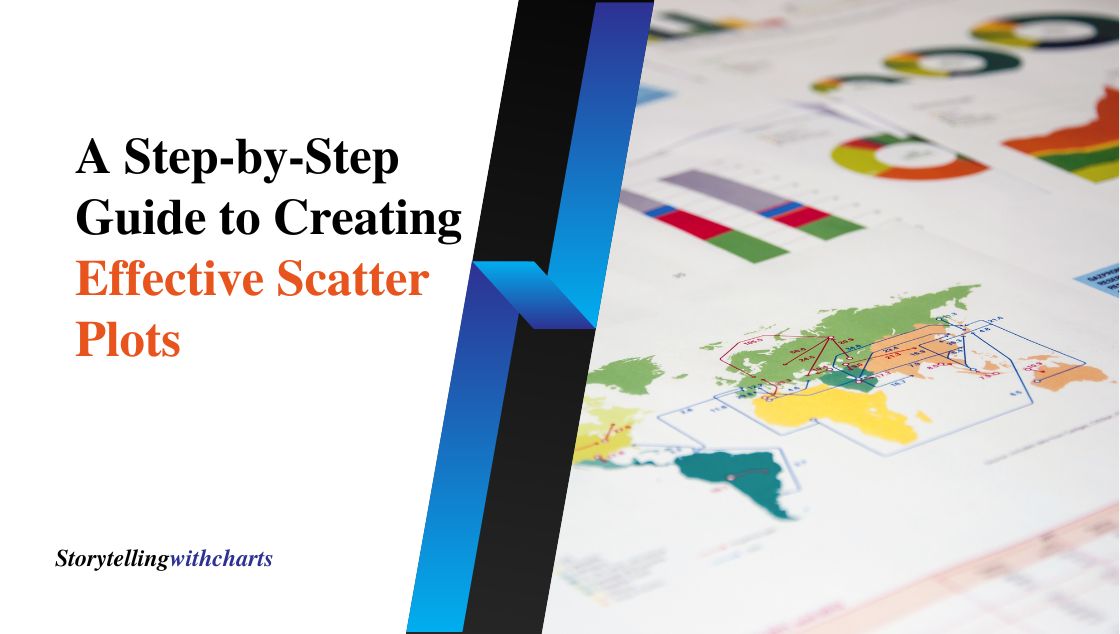
A Step-by-Step Guide to Creating Effective Scatter Plots
A scatter plot, also known as a scatter graph, is a type of graph that uses Cartesian coordinates to display…
Read More
Data AnalysisData CommunicationData StorytellingData Storytelling TechniquesData VisualizationData Visualization SoftwareHow Storytelling charts worksNarrative ChartsPie ChartsStorytelling with chartsStorytelling with DataVisual Storytelling
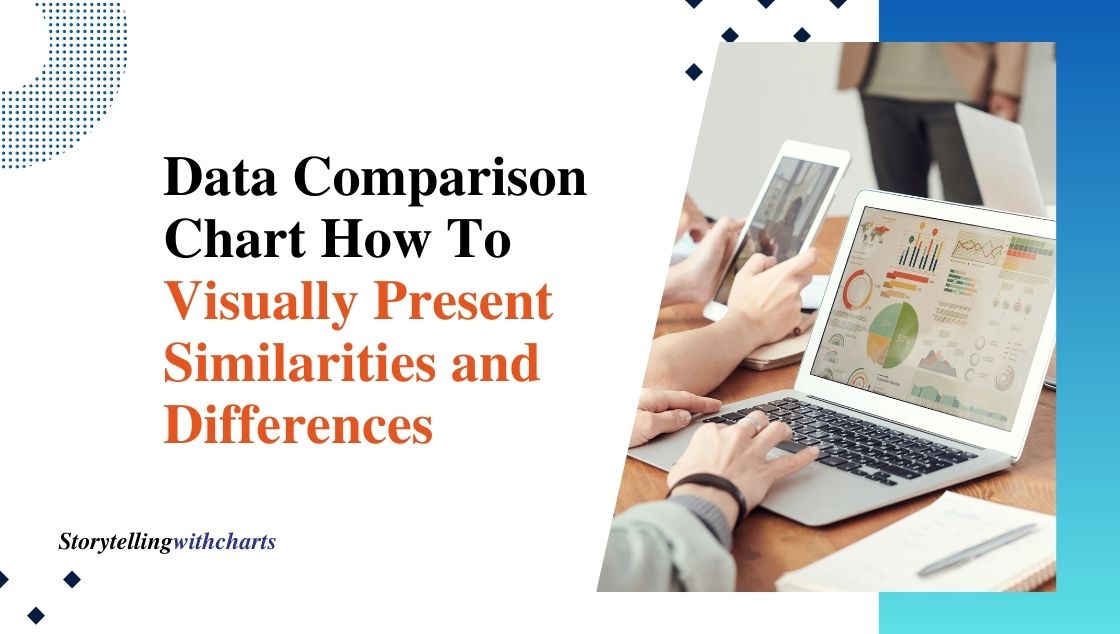
Data Comparison Chart: How To Visually Present Similarities and Differences
Effectively highlighting similarities and differences is crucial for insightful data analysis. Data comparison charts provide simplified and authoritative visual formats…
Read More
Data AnalysisData CommunicationData StorytellingData Storytelling TechniquesData VisualizationData Visualization SoftwareHow Storytelling charts worksStorytelling with chartsStorytelling with DataVisual Storytelling
How to Add Context with Graph Numbers on Your Business Presentations
A key part of any effective business presentation is visualizing data that communicates insights. However, graphs and charts need context…
Read More

