Transform Your Data into Compelling Visual Stories
Transform Your
Data into
Compelling Visual Stories
The free forever PowerPoint add-in that helps you create stunning charts and visualizations in seconds.
Why Choose STC AI?

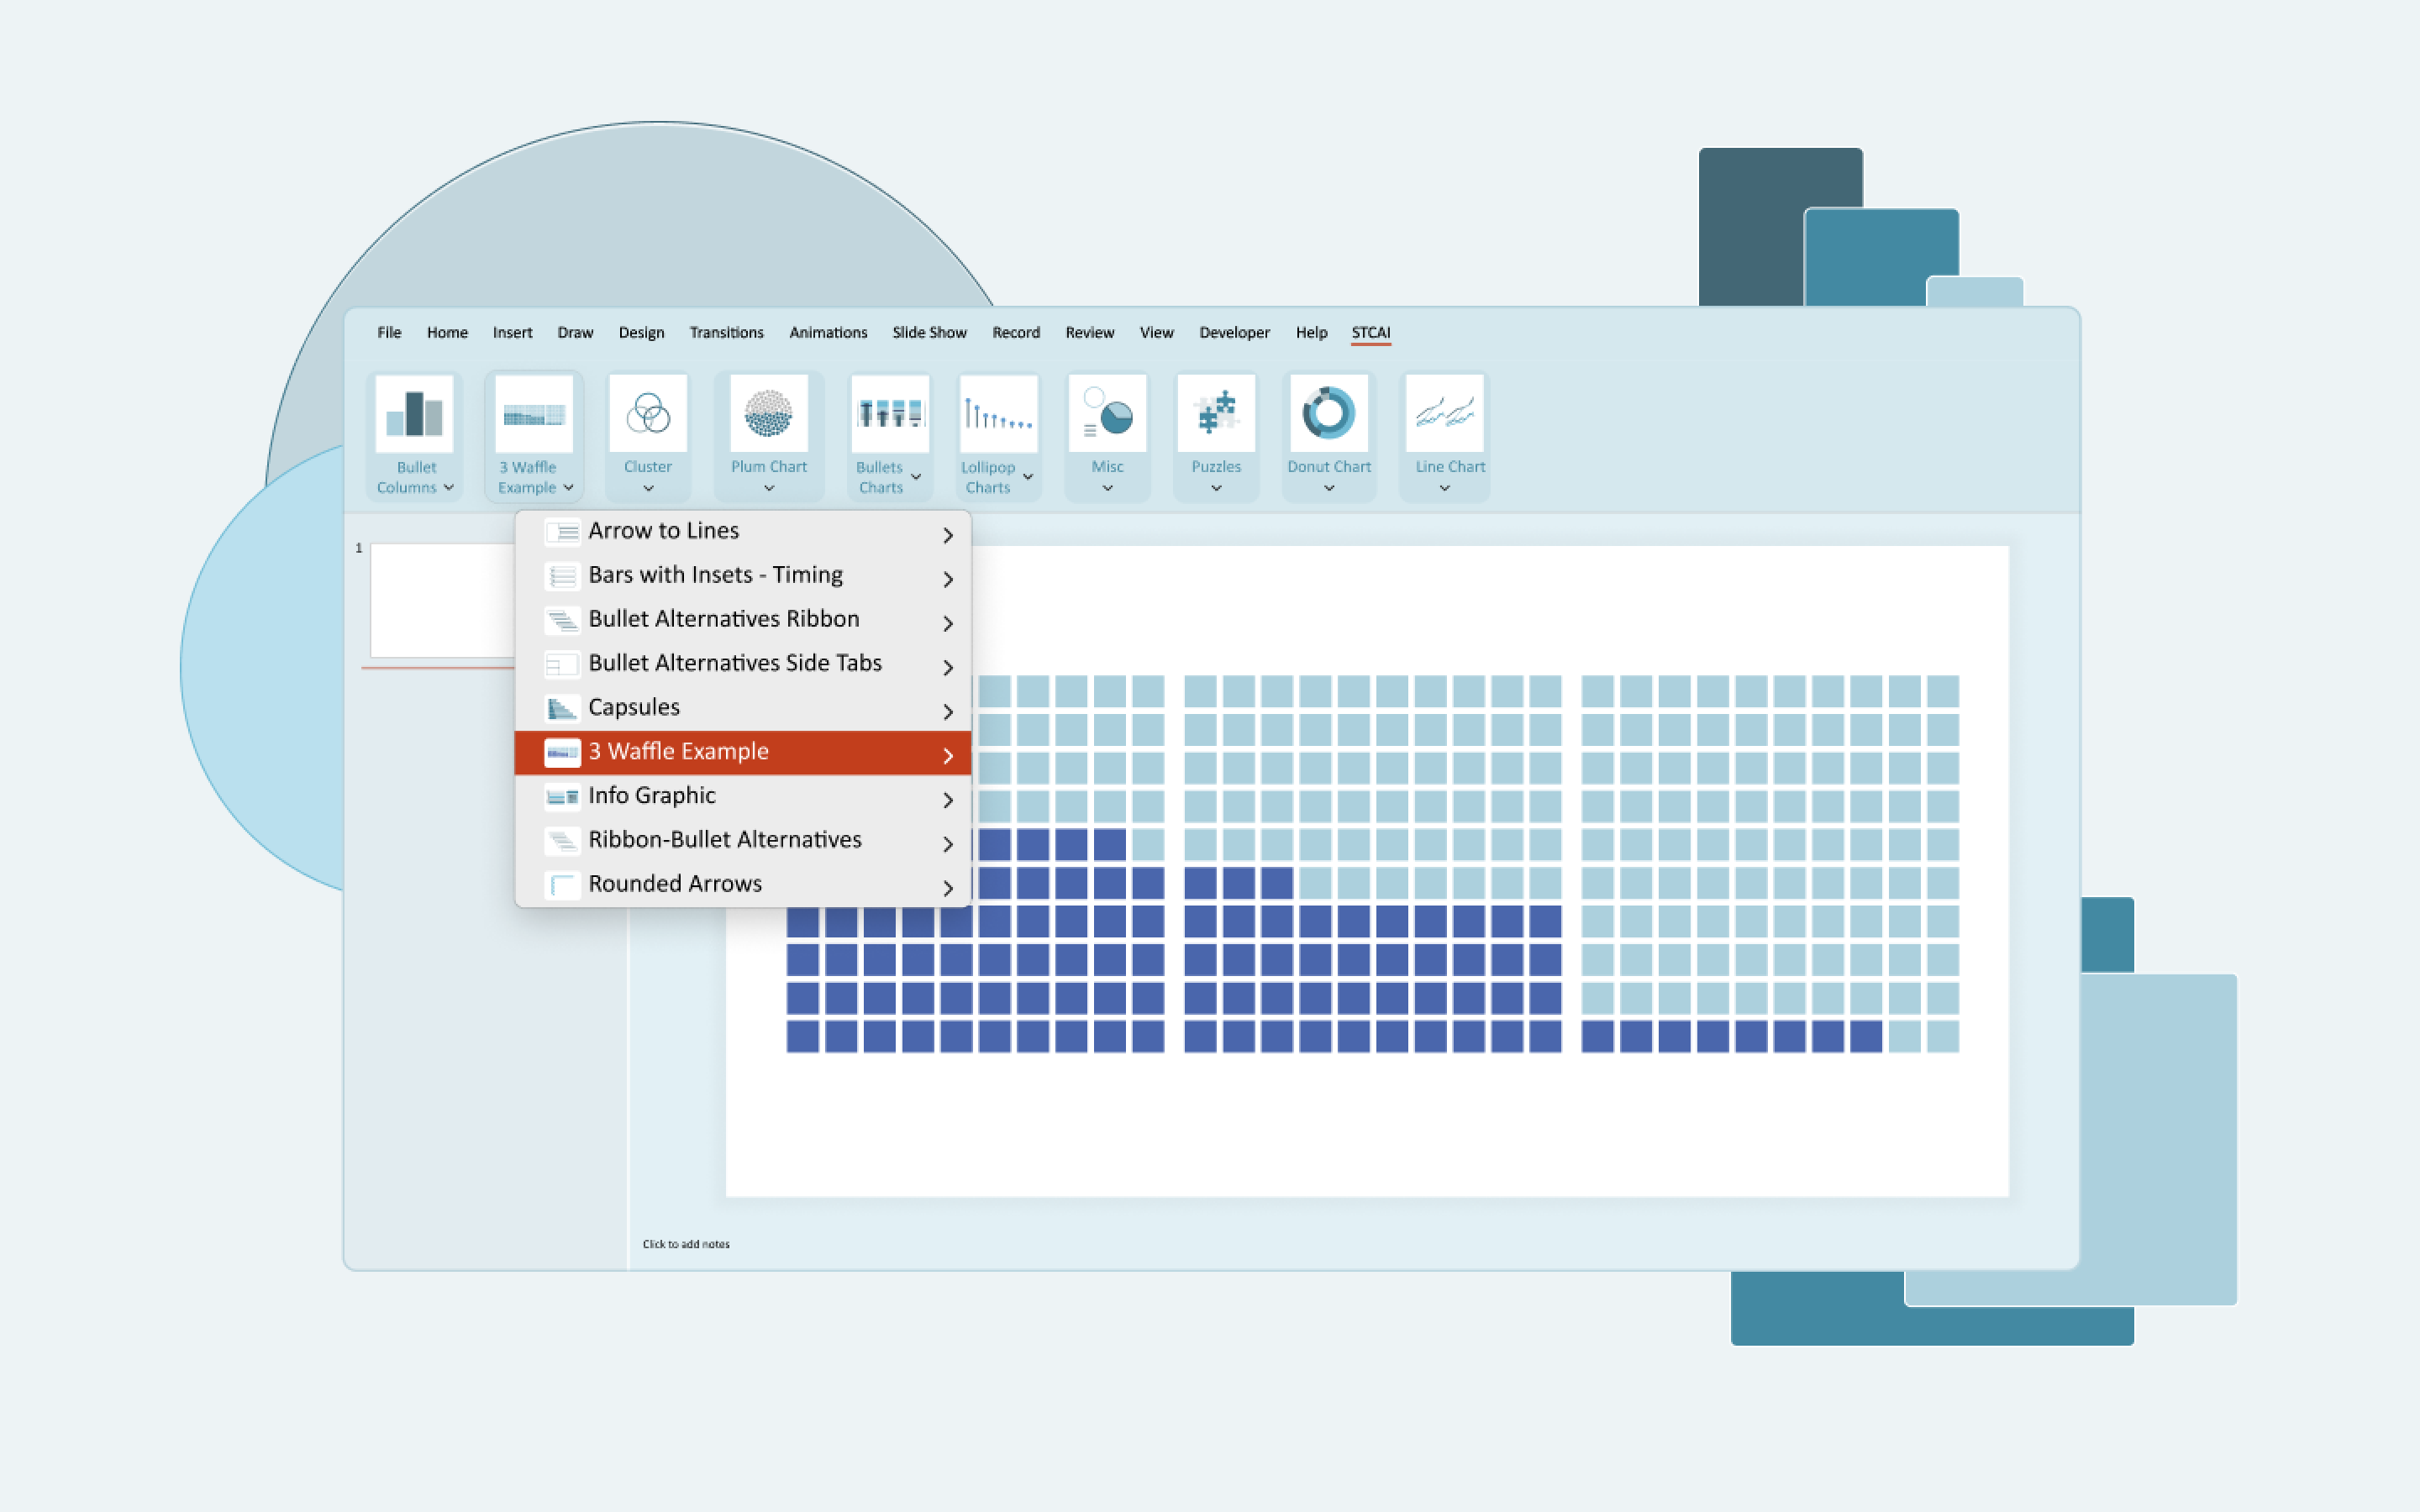
One-Click Beautiful Charts
Transform ordinary Excel data into compelling, presentation-ready charts with just one click. Choose from dozens of professionally designed templates.

Save Hours of Work
What used to take hours now takes seconds. Automate formatting, layout, and styling while maintaining complete control over your charts.

Tell Better Data Stories
Highlight key insights and guide your audience through the data with powerful annotation, callout, and emphasis tools.

Live Data Connection
Keep your charts automatically updated when your data changes. No more manual chart recreation when numbers are adjusted.

Custom Branding
Easily apply your company's colors, fonts, and styling to all charts with our brand preset system.

100% Free Forever
Unlike competitors who charge hundreds per year, StorytellingWithCharts is completely free. No trial periods, no feature limitations, no hidden costs.
How It Works
Install the Add-in
Download the free PowerPoint add-in and set it up in seconds with a simple and seamless installation process.
Select Your Data
Clarify the key message behind your data and decide how it should be visually presented to support your narrative.
Create & Customize
Use powerful native charts, smart utilities, and AI-powered tools to instantly build and refine stunning data stories.
Simple Pricing
$0
Free Forever. No Catch.

All chart types and templates
Excel & PowerPoint integration
Brand preset system
Live data connection
Advanced annotation tools
Regular updates and new features

The plugin is free — all we ask is a newsletter subscription. Promise, no spam — only the stuff that matters!

What Our Users Say


Find Your Answers Here
We’ve compiled answers to your most frequently asked questions. Get the information you need quickly and easily.
What are add-ins in PowerPoint?
Add-ins are tools or plugins that extend the functionality of PowerPoint, allowing users to add features like advanced charts, visuals, automation, or interactivity to their presentations.
What is STC AI, and how does it enhance PowerPoint?
STC AI is a free PowerPoint add-in that simplifies storytelling with data. It provides customizable charts, templates, and advanced data visualization tools to help users create impactful and professional presentations quickly and easily.
How do I add an add-in to PowerPoint?
To download the STC AI plugin, follow these steps:
- Go to the homepage and click the “Download” button.
- Fill in your First Name, Last Name, and Email Address to receive your unique license key via email.
- Once you’ve submitted the information, you will be redirected to the Download page, where you can choose and download the Windows or Mac version of the plugin.
Installation Instructions:
- Open the downloaded file and follow the steps displayed in the installation window.
- That’s it! The process is simple and secure.
What makes STC AI one of the best PowerPoint add-ins?
STC AI stands out because it’s a completely free tool that simplifies data storytelling. It offers:
- A wide range of customizable chart templates.
- Tools for advanced data visualization to make complex data easy to understand.
- Seamless integration with PowerPoint for smooth workflows.
- A user-friendly interface designed for professionals, educators, and students.
With STC AI, you can save time, enhance your presentations, and create visuals that leave a lasting impression.
How can I customize charts using STC AI?
With STC AI, you can customize every aspect of a chart, including:
- Colors, fonts, and layout styles.
- Adding or editing data points.
-
Adjusting sizes to match your presentation needs.
Choose from ready-to-use templates and save time creating visuals.
Can I use STC AI offline?
Yes, once installed, STC AI works offline. You only need an internet connection for downloading and installing the add-in.
How do I uninstall an add-in in PowerPoint?
Instructions to uninstall on Windows:
Method 1: From the Microsoft Windows Control Panel
- Open the list of installed programs in the Control Panel:
- Press Start or the Windows key → type Control Panel → press Enter → go to Programs and Features.
- Find STC AI in the list, select it, and click the Control Panel’s Uninstall button.
Method 2: Uninstall or disable the plugin from PowerPoint
- Open PowerPoint.
- Go to File > Options > Add-ins.
- At the bottom of the window, select COM Add-ins from the dropdown menu and click Go.
To temporarily disable the plugin:
- Find STC AI in the list and uncheck it.
- Click OK to disable the plugin.
To remove the plugin completely:
- Return to the Add-ins section, select COM Add-ins, and click Go.
- Select STC AI in the list and click Remove.
Instructions to uninstall on Mac:
Method 1: Using our Uninstaller
When you install the plugin file from the website, two applications are installed automatically:
- STCAI (with the plugin), and
- STCAI Uninstall
To uninstall the plugin, follow these steps:
- Launch the STCAI Uninstall application.
- Agree to the permission prompts when they appear.
- In the system confirmation window, enter your Mac password (this is the same as the one required for uninstalling other applications) or use Touch ID if enabled.
- Once confirmed, the plugin will be uninstalled, and both applications (STCAI and STCAI Uninstall) will be removed from your system.
Method 2: Uninstall or disable the plugin from PowerPoint
- Open PowerPoint.
- On the top menu bar, go to Tools > PowerPoint Add-ins.
To temporarily disable the plugin:
- Find STC AI in the list and uncheck it.
- Click OK to disable the plugin.
To remove the plugin completely:
- Return to the PowerPoint Add-ins section.
- Select STC AI in the list and click the “-” symbol under the section.
- Save the changes to complete the removal.
Is STC AI free?
Yes! STC AI is completely free to download and use, with no hidden charges or subscriptions.
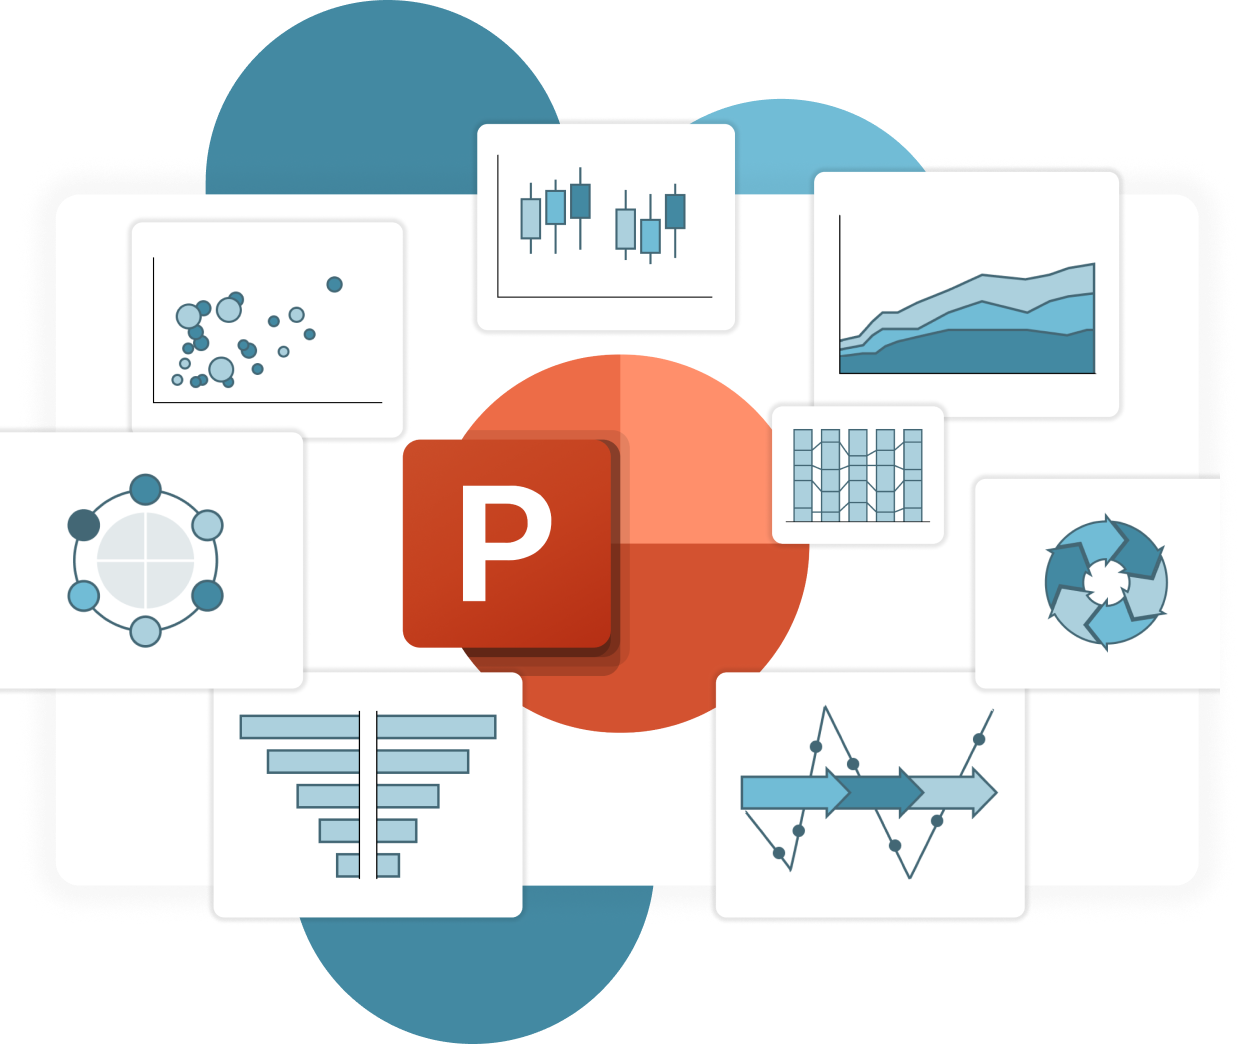
What are the chart types supported by STC AI?
STC AI supports a wide range of PowerPoint charts, including:
- Bar Chart
- Column Chart
- Line Chart
- Pie Chart
- Area Chart
- Scatter Plot
- Doughnut Chart
- Radar Chart
- Funnel Chart
- Combo Chart
- And 50+ charts and graphs
These charts are fully customizable to suit your presentation style and needs.
Can I use STC AI for professional business presentations?
Absolutely! STC AI is designed for professionals, educators, and businesses. It enables you to create clean, professional visuals for reports, meetings, or client presentations with ease.
I can’t find the STC AI email with the download link. What should I do?
If you haven’t received the email:
- Check your Spam or Junk folder.
- Ensure you entered the correct email address during registration.
- If the issue persists, contact our support team at support@storytellingwithcharts.com.
How do I update my STC AI plugin?
If you’re using Windows or Mac and have PowerPoint open, you’ll automatically receive a notification when a new version of our plugin is available.
Simply click Update, and the latest version will replace the old one seamlessly.
There’s no need to visit our website to search for updates or uninstall the existing plugin manually. The update process is quick and hassle-free.
Are PowerPoint add-ins safe to use?
Yes, PowerPoint add-ins downloaded from trusted sources like the Microsoft Office Store or verified websites (like STC AI) are safe to use.
STC AI is secure, free from malware, and adheres to data privacy protocols.
Which versions of PowerPoint are compatible with STC AI?
STC AI is compatible with Microsoft PowerPoint 2021 and later versions, including Office 365. Keeping your PowerPoint software updated ensures the best performance.
How do add-ins help improve my PowerPoint presentations?
Add-ins like STC AI provide additional tools to improve your presentations, such as:
- Creating professional charts and visuals.
- Automating repetitive tasks.
- Adding interactive features like polls or stock images.
They save time and improve the quality of your slides.
Can I share presentations created using STC AI?
Yes, presentations made with STC AI are fully shareable and editable, just like any standard PowerPoint file.
Can I use my license on multiple computers?
Yes, you can use your license on multiple computers, but only one device at a time. If you activate the plugin on a new computer, the previous session will automatically be deactivated. To continue using the plugin on the first device, you will need to re-enter your license key.
This ensures that your license remains secure and tied to a single active session at any given moment. If you frequently switch between devices, simply enter your key each time you change computers.
Start Creating Beautiful Charts Today
Join thousands of professionals who are saving time and impressing clients with stunning data visualizations.