Data AnalysisData CommunicationData StorytellingData Storytelling TechniquesData Visualization SoftwareHow Storytelling charts worksPie ChartsStorytelling with chartsStorytelling with Data
A Quick Guide to Online Chart and Graph Makers for Every Skill Level
Today, the ability to create charts and graphs effectively is not just a skill but a necessity for anyone dealing…
Read More
Data AnalysisData CommunicationData StorytellingData Storytelling TechniquesData VisualizationData Visualization SoftwareHow Storytelling charts worksStorytelling with chartsStorytelling with DataVisual Storytelling
Combining Data Analytics and Engaging Visuals for Impactful Insights
In today’s data-driven world, organizations are inundated with vast amounts of information from various sources. However, more than raw data…
Read More
Data AnalysisData CommunicationData StorytellingData Storytelling TechniquesData VisualizationData Visualization SoftwareHow Storytelling charts worksNarrative ChartsStorytelling with chartsStorytelling with DataVisual Storytelling
Using Data Narrative and Storytelling to Engage Your Audience
Storytelling is a powerful tool for making connections and relaying information. When woven into an engaging, purposeful narrative, data can…
Read More
Data AnalysisData CommunicationData StorytellingData Storytelling TechniquesData VisualizationData Visualization SoftwareHow Storytelling charts worksStorytelling with chartsStorytelling with DataVisual Storytelling
How to Improve Your Data Literacy Through Storytelling
Data and numbers can often feel dry and uninspiring. But when data is combined with storytelling, it comes alive in…
Read More
Data AnalysisData CommunicationData StorytellingData Storytelling TechniquesData VisualizationData Visualization SoftwareHow Storytelling charts worksStorytelling with chartsStorytelling with Data
Create Stunning Time Series Charts for Data Storytelling with These Tips
In data analysis, using narratives is a good way to share complicated information in a clear way. Time series charts…
Read More
Data StorytellingData Storytelling TechniquesData VisualizationData Visualization SoftwareHow Storytelling charts worksStorytelling with chartsStorytelling with Data
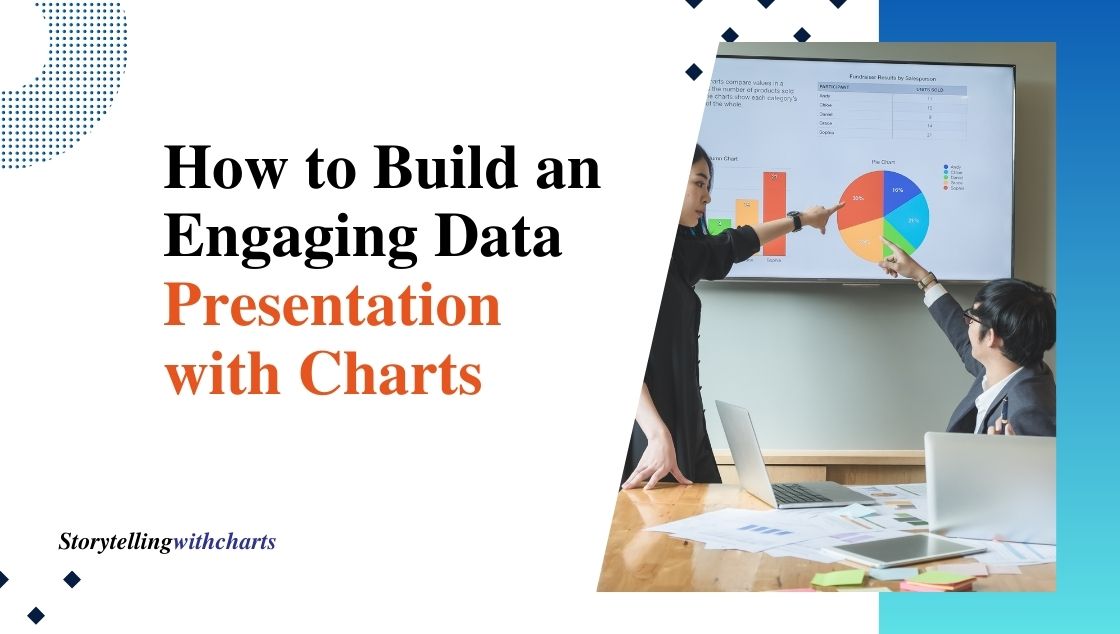
How to Build an Engaging Data Presentation with Charts
In our world now, where data is very important, data presentation is essential to share complicated information effectively. Combining data…
Read More
Data AnalysisData CommunicationData StorytellingData Storytelling TechniquesData VisualizationData Visualization SoftwareHow Storytelling charts worksStorytelling with chartsStorytelling with Data
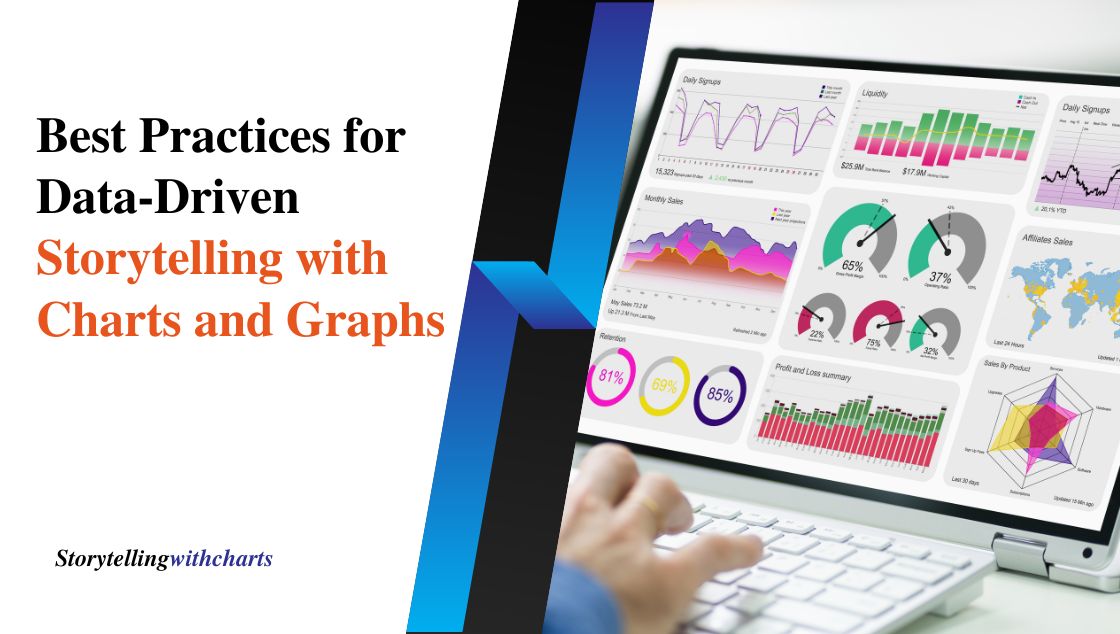
Best Practices for Data-Driven Storytelling with Charts and Graphs
Data-driven storytelling has turned into a key part of making decisions across different fields. Using tools for visualizing data, such…
Read More
Data AnalysisData CommunicationData StorytellingData Storytelling TechniquesData VisualizationData Visualization SoftwareHow Storytelling charts works
Data Storytelling 101 – Essential Graphs and Charts for Beginners
In today’s world, where data is a crucial factor, being able to share information effectively is really essential. This is…
Read More
Data AnalysisData CommunicationData StorytellingData Storytelling TechniquesData VisualizationData Visualization SoftwareHow Storytelling charts worksStorytelling with chartsStorytelling with Data
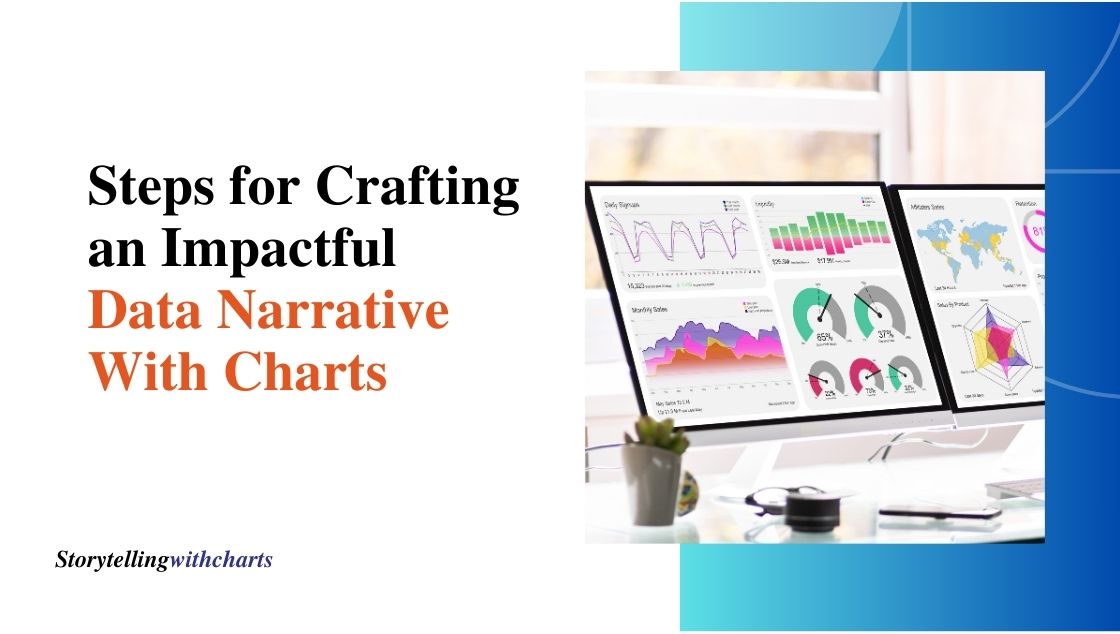
Steps for Crafting an Impactful Data Narrative With Charts
Data storytelling, which indicates a necessary shift in how people interpret the vast amount of data available, has become a…
Read More

