Complete Guide to Creating Nautical Charts in PowerPoint
Nautical charts are essential for safe navigation, showing critical details like water depths, obstacles, buoys, and landmarks. While professional-grade charts…
Read More
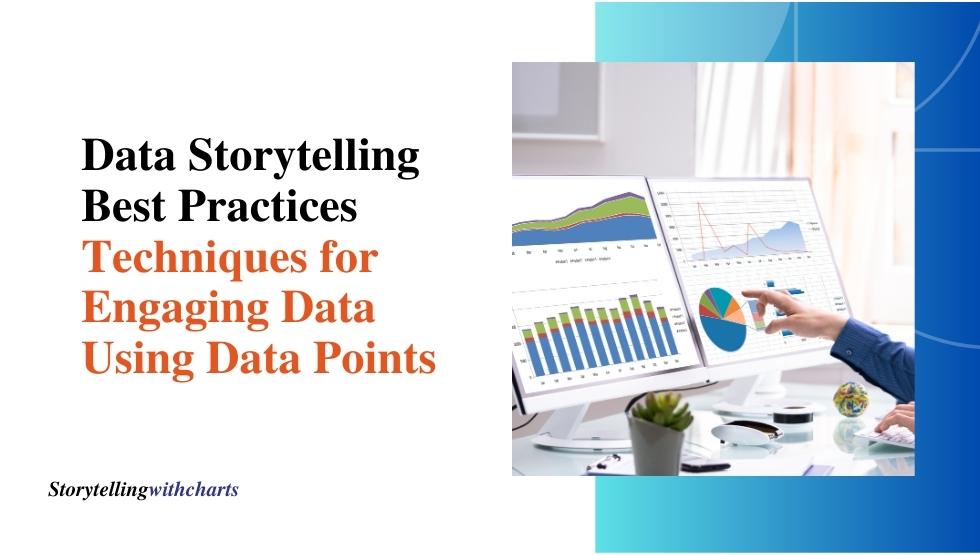
Data Storytelling Best Practices: 5 Techniques for Engaging Data Using Data Points
Data is everywhere today – from websites tracking user behaviour to sensors collecting information in manufacturing plants. Making sense of…
Read More
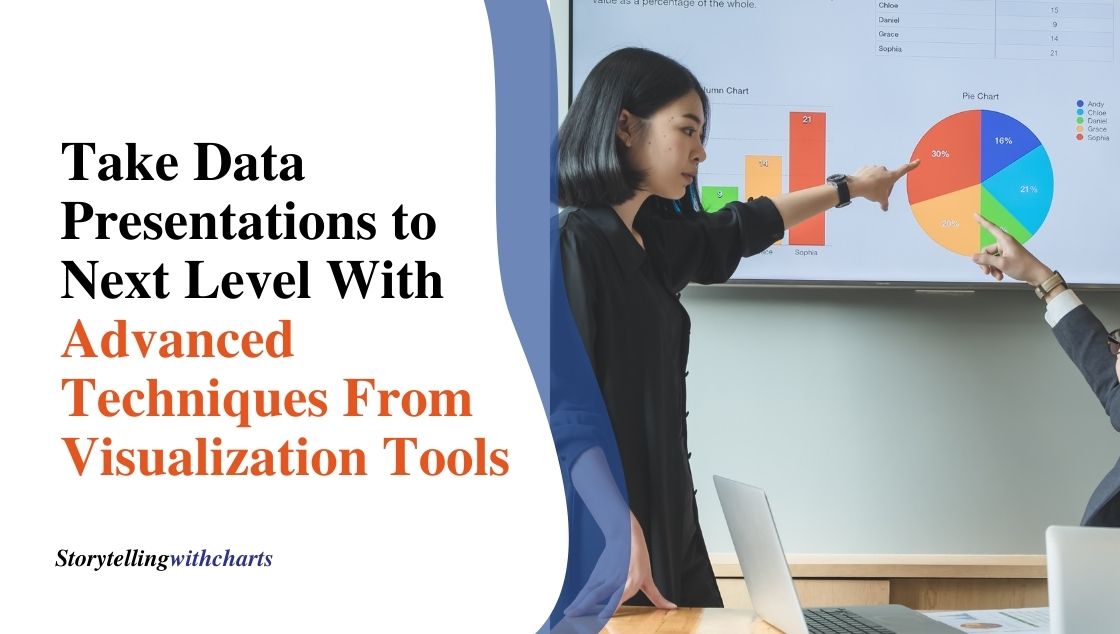
Take Data Presentations to Next Level With 7 Advanced Techniques From Visualization Tools
Data visualization is a crucial aspect of data analysis and business intelligence. With the right visualizations, data presentations can become…
Read More
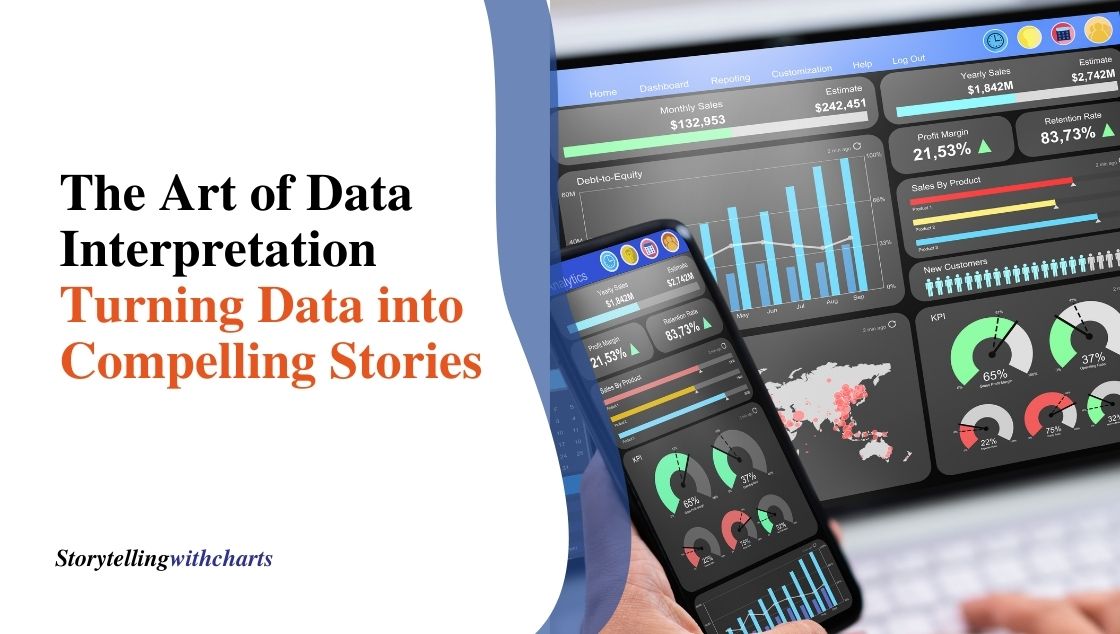
The Art of Data Interpretation: Turning Data into Compelling Stories
We are living in an era of big data. Organizations across all industries collect vast amounts of data about their…
Read More
Data AnalysisData CommunicationData StorytellingData Storytelling TechniquesData VisualizationData Visualization SoftwareHow Storytelling charts worksStorytelling with chartsStorytelling with DataVisual Storytelling
A Step-by-Step Guide to Creating Effective Scatter Plots
A scatter plot, also known as a scatter graph, is a type of graph that uses Cartesian coordinates to display…
Read More
Data AnalysisData CommunicationData StorytellingData Storytelling TechniquesData VisualizationData Visualization SoftwareHow Storytelling charts worksNarrative ChartsPie ChartsStorytelling with chartsStorytelling with DataVisual Storytelling
Data Comparison Chart: How To Visually Present Similarities and Differences
Effectively highlighting similarities and differences is crucial for insightful data analysis. Data comparison charts provide simplified and authoritative visual formats…
Read More
Data AnalysisData CommunicationData StorytellingData Storytelling TechniquesData VisualizationData Visualization SoftwareHow Storytelling charts worksStorytelling with chartsStorytelling with DataVisual Storytelling
How to Add Context with Graph Numbers on Your Business Presentations
A key part of any effective business presentation is visualizing data that communicates insights. However, graphs and charts need context…
Read More
Data AnalysisData CommunicationData StorytellingData Storytelling TechniquesData VisualizationData Visualization SoftwareHow Storytelling charts worksStorytelling with chartsStorytelling with DataVisual Storytelling
Turning Tables into Insightful Visuals With Table Charts
Tables and charts are two common ways to represent data visually. However, they serve different purposes. Choosing the right one…
Read More
Data AnalysisData CommunicationData StorytellingData Storytelling TechniquesData Visualization SoftwareHow Storytelling charts worksPie ChartsStorytelling with chartsStorytelling with Data
A Quick Guide to Online Chart and Graph Makers for Every Skill Level
Today, the ability to create charts and graphs effectively is not just a skill but a necessity for anyone dealing…
Read More

