Data AnalysisData CommunicationData StorytellingData Storytelling TechniquesData VisualizationData Visualization SoftwareHow Storytelling charts works
How to Create Stunning Data Charts in Excel for Data Storytelling
Do your eyes automatically shut off every time you hear the words Excel and spreadsheets? But wait, we know the…
Read More
Simplify Data Visualization with our Pie Chart Generator
Ever felt like you’re navigating a maze when trying to make sense of complex data? We’ve walked in those shoes…
Read More
Data AnalysisData CommunicationData Storytelling TechniquesData VisualizationData Visualization SoftwareStorytelling with DataUncategorized
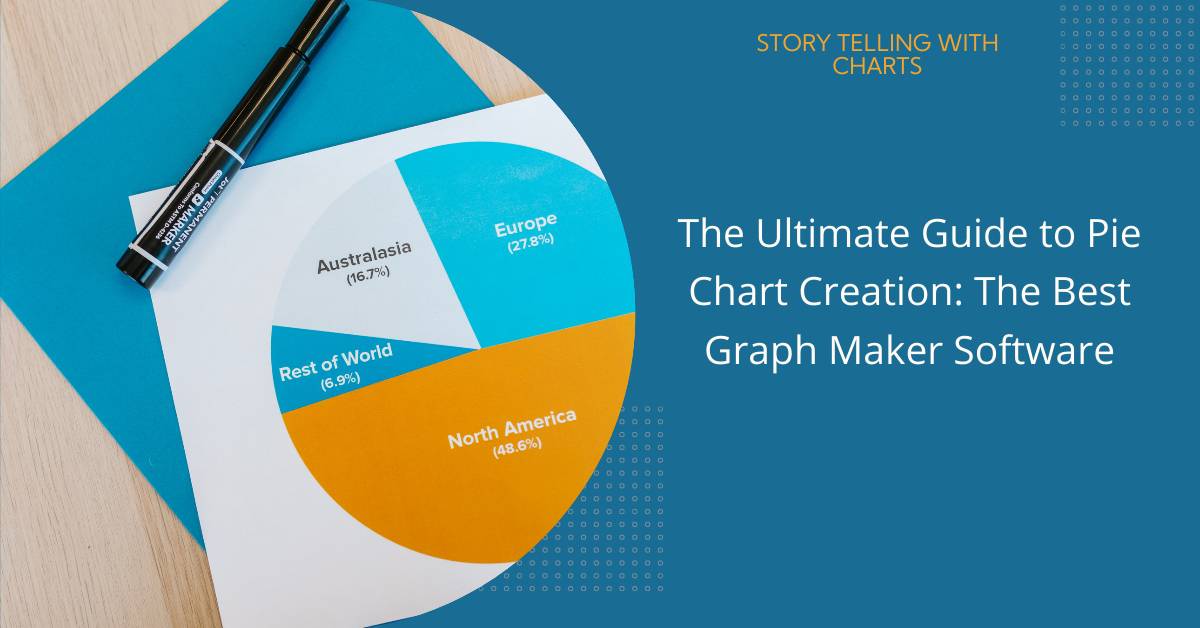
Pie Charts and Data Visualization: Communicating Insights with Impact
Pie charts and data visualization can feel overwhelming, especially when you’re tasked with turning raw data into a compelling story.…
Read More
The Art of Storytelling: Utilizing Pie Charts in Data Visualization
Data visualization can seem complex, especially when it comes to pie charts. Yet, these charts are effective tools for communicating…
Read More
Data AnalysisData Storytelling TechniquesData VisualizationSTC ToolkitStorytelling with chartsStorytelling with Data
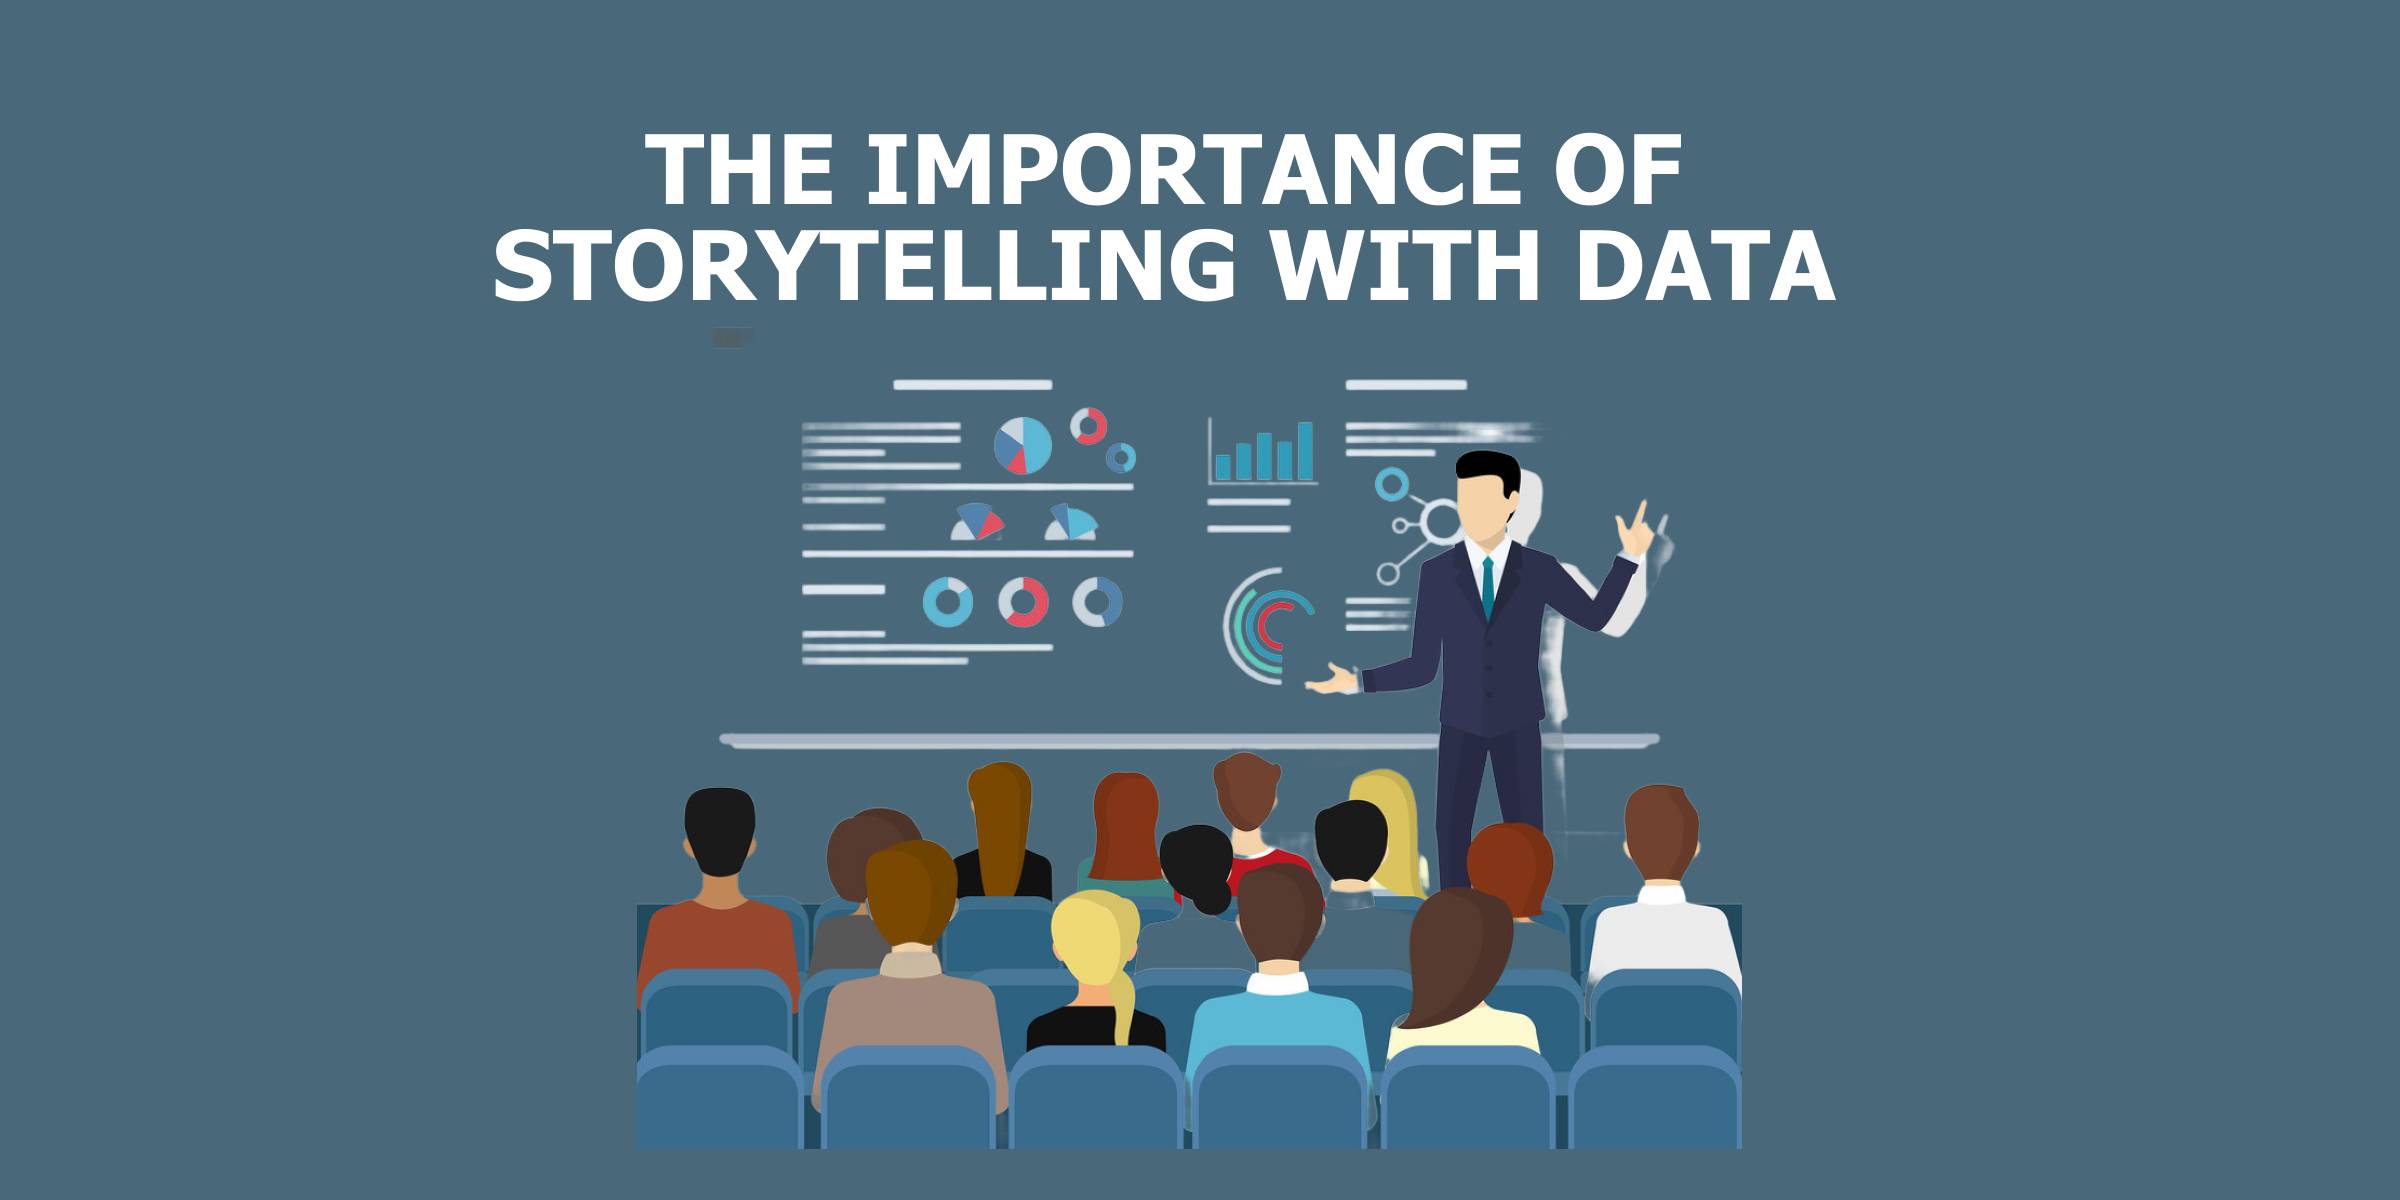
The Importance of Storytelling with Data
Data alone is often not enough to convey complex information in a way that truly resonates with an audience. That’s…
Read More


