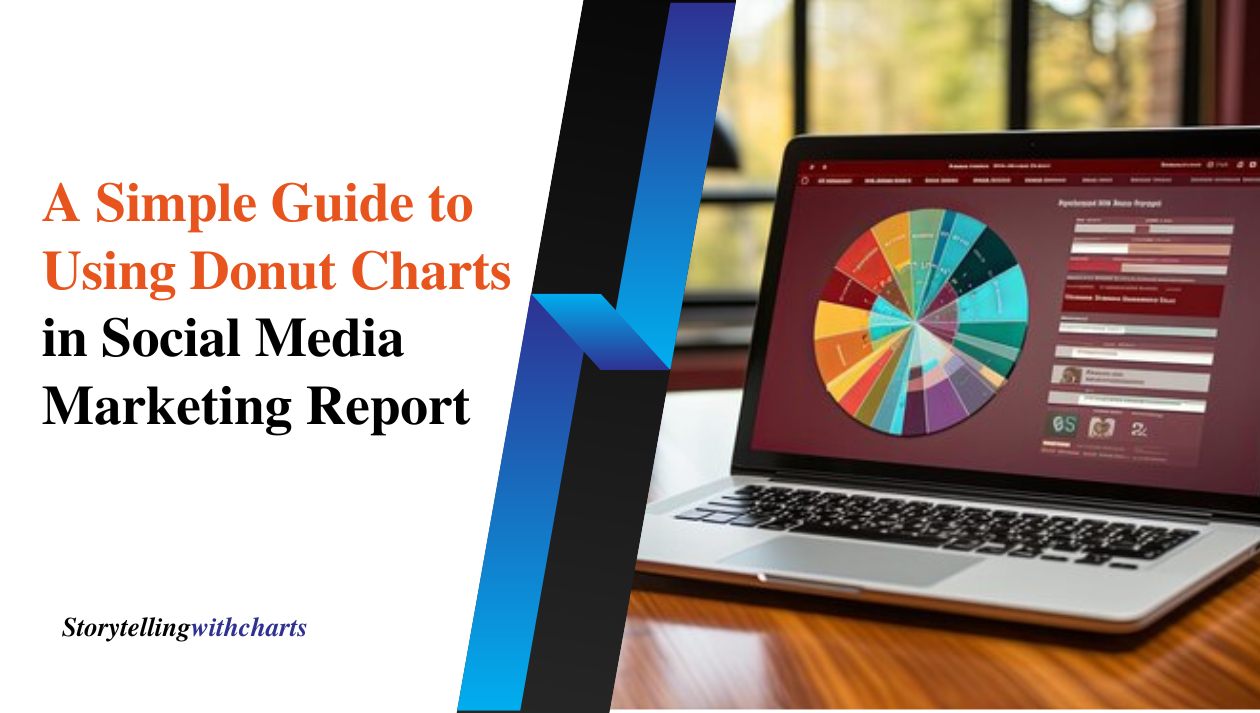
A Simple Guide to Using Donut Charts in Social Media Marketing Report
Social media has become an integral part of marketing strategies in the digital age. To measure the success of social…
Read More
How to Create and Interpret a Histogram in Excel: Real-World Examples for Sales and Research
A histogram is a statistical graphical representation that visualises a dataset’s distribution, spread, and shape. It shows the frequency of…
Read More
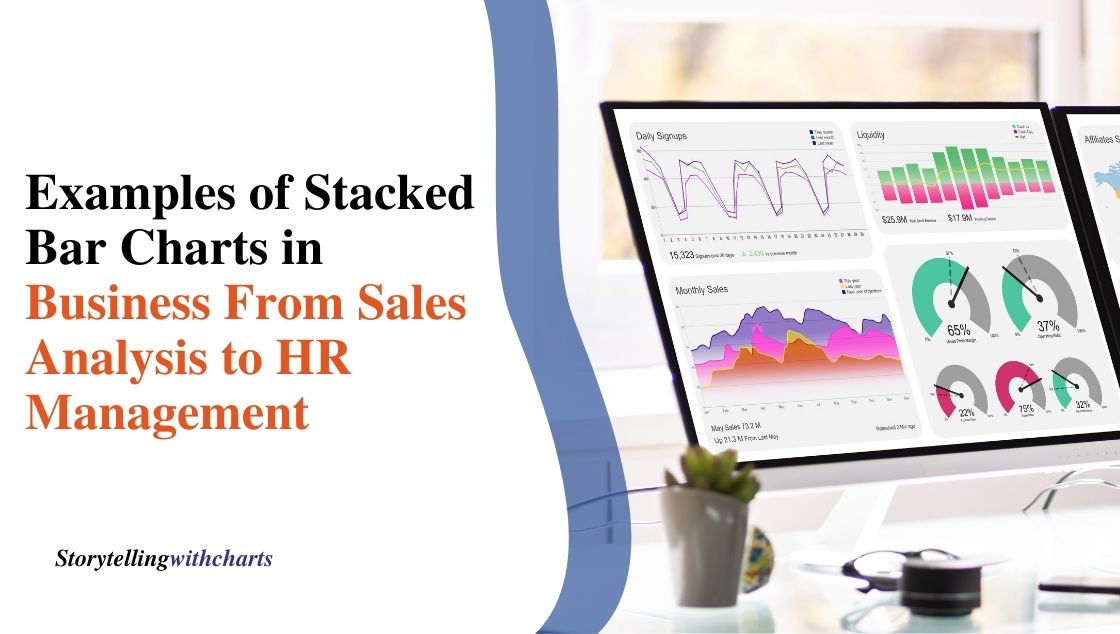
Examples of Stacked Bar Charts in Business: From Sales Analysis to HR Management
Stacked bar charts are versatile visualization tools used across industries to compare categorical data across multiple dimensions. The key benefit…
Read More
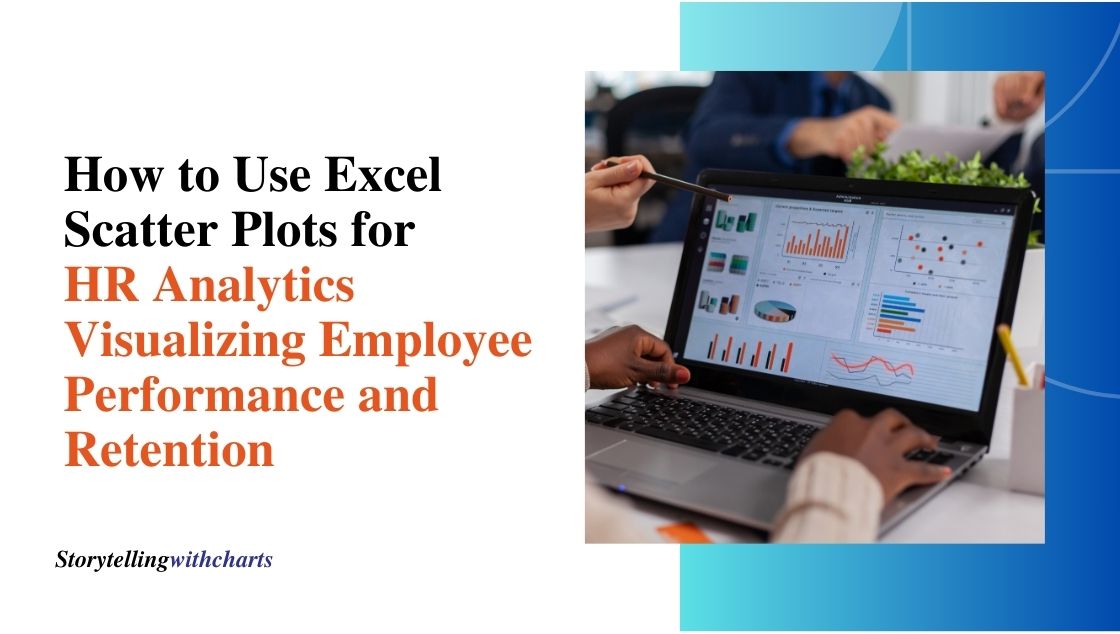
How to Use Excel Scatter Plots for HR Analytics: Visualizing Employee Performance and Retention
Human resources (HR) analytics involves collecting and analyzing employee data to uncover insights and predict outcomes that impact the workforce.…
Read More
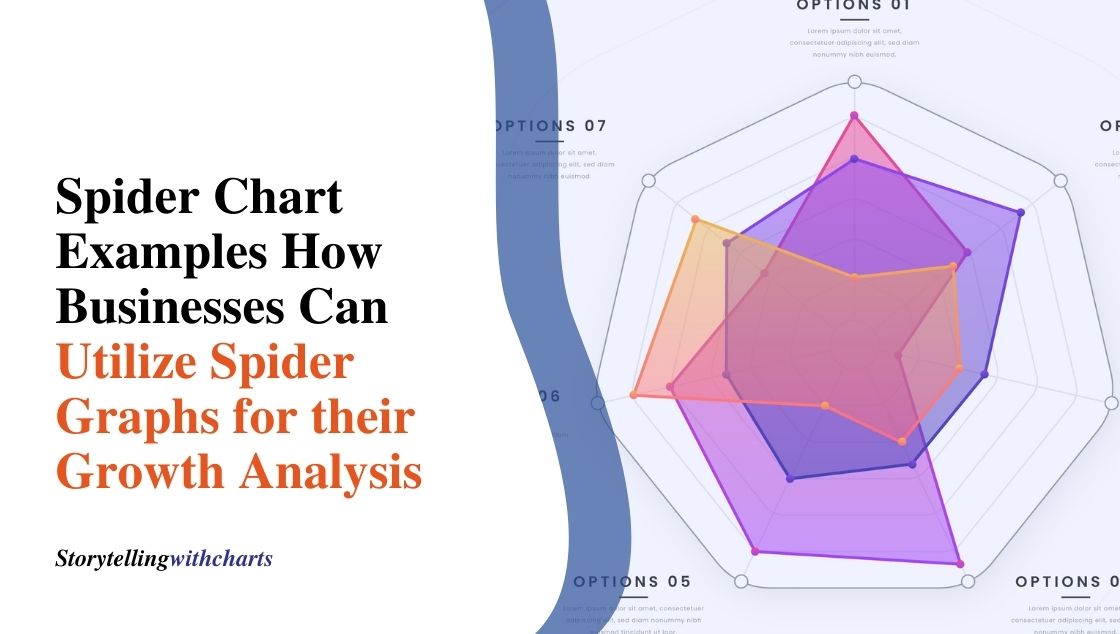
Spider Chart Examples: How Businesses Can Utilize Spider Graphs for their Growth Analysis
Spider charts, also known as radar charts or web charts, are a unique way to visually display multivariate data and…
Read More
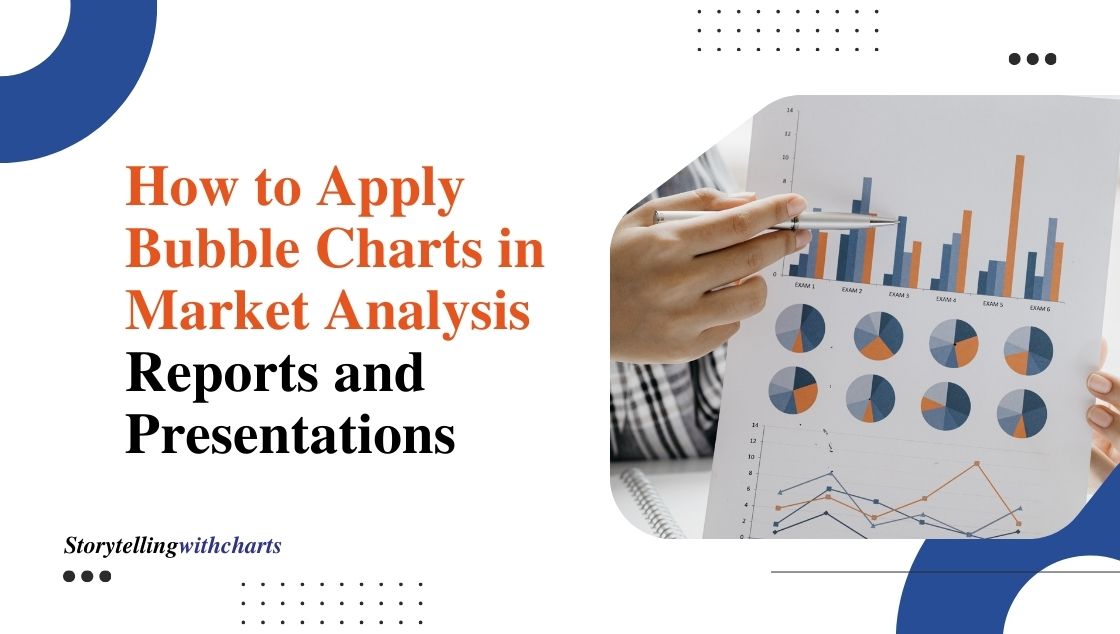
How to Apply Bubble Charts in Market Analysis Reports and Presentations
Bubble charts provide a powerful way to visualize complex data intuitively. By plotting categories on the X-axis, performance metrics on…
Read More
Understanding Profit and Loss with Waterfall Charts: A Guide for Business Professionals
As a business leader, deeply understanding your company’s profitability and cash flow is critical. Without clarity about your finances, making…
Read More
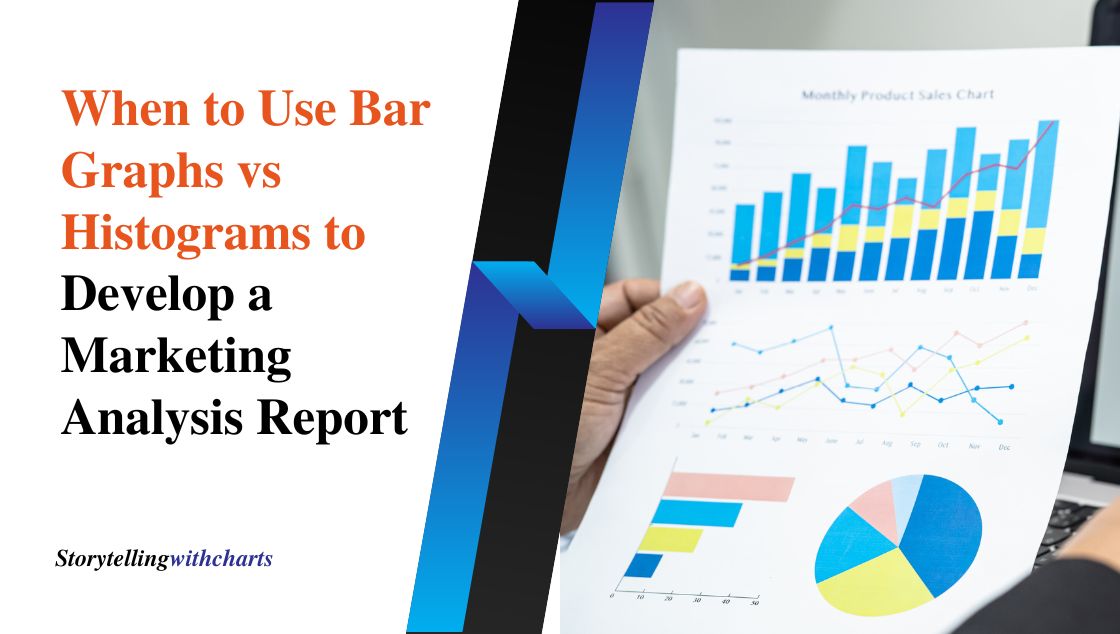
When to Use Bar Graphs vs Histograms to Develop a Marketing Analysis Report
When creating a data-driven marketing analysis report, choosing the right type of chart or graph to visualize your findings is…
Read More
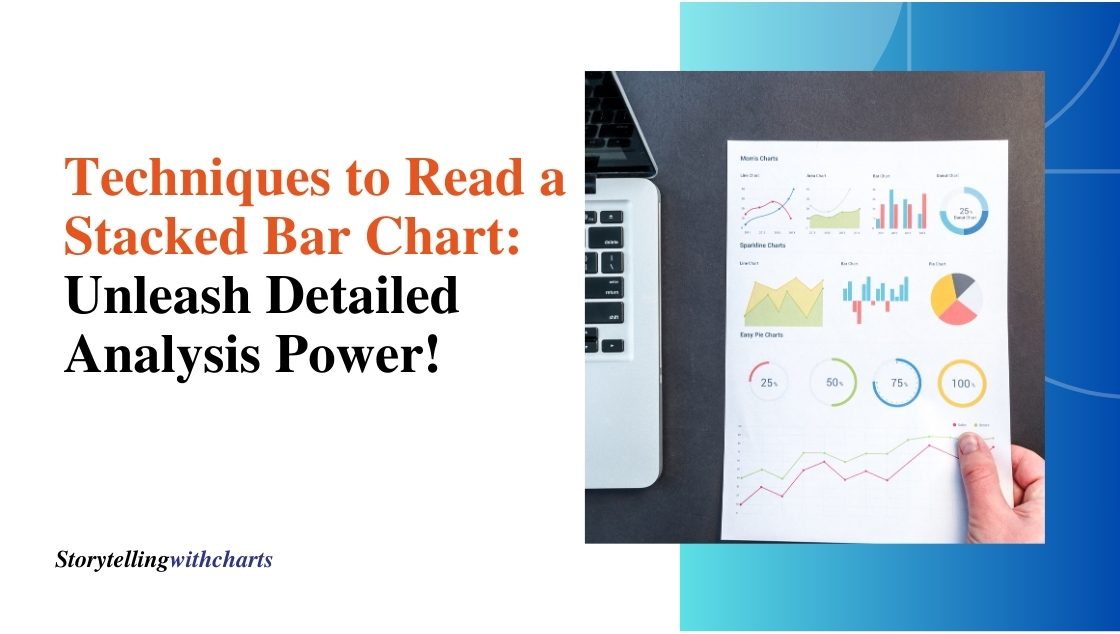
5 Techniques to Read a Stacked Bar Chart: Unleash Detailed Analysis Power!
A stacked bar chart is a type of bar chart that allows you to break down and compare parts of…
Read More

