5 Ways Businesses Are Predicting the Future With Data Visualization
From spotting trends to weather forecasts, predictions and predictive data visualization help us plan for the future. Businesses are now using the power of data and technology to peek into the future. Digital tools allow companies to forecast risks and opportunities across different parts of a business.
Organizations make more innovative moves for the future by unlocking insights from data patterns. Using data to see change ahead of time can give companies a major competitive advantage. In the section below, we’ll discuss the different ways companies leverage data to predict outcomes.
The evolution of data visualization tools and technologies
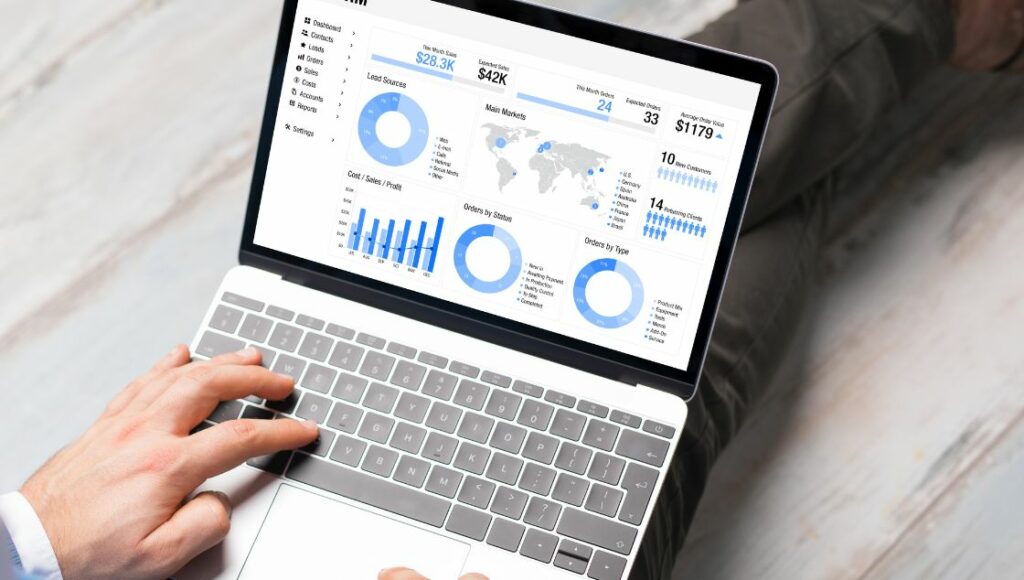
The evolution of data visualization technologies over recent years has been remarkable – far surpassing the basic charts and graphs used in the past. Legacy visualization methods like bar and pie charts have given way to interactive dashboards, filtering, animation, rich multimedia and more. This has been enabled by the rise of big data – massive information sets generated by modern systems. Legacy approaches struggle to depict volumes of data at such velocity and variety. Accordingly, contemporary data visualization leverages expanded analytics capacities and modern web/mobile platforms.
Sophisticated software now empowers intuitive evaluation of immense datasets. Automated analysis spotlighting anomalies and predictive modeling assisted by AI algorithms also enhance modern tools. The future promises even more immersive technologies like virtual reality data environments as the field continues rapidly innovating. While static charts sufficed previously, interactive multimedia visualization is becoming integral to unlocking insights from expansive high-velocity information streams powering the cutting edge.
Ways in which businesses are predicting the future with data visualization

Leveraging current knowledge to glimpse what lies ahead has long been important for making good choices. Today, data visualization empowers companies to bring that foresight into sharper focus.
1. Spotting market shifts
Every industry sees waves of change. New products and services come along. New competitors enter the scene. Customer interests and economic conditions shift all the time. Data helps businesses spot key trends early before they disrupt a market.
Sales data over time shows what products are gaining or losing momentum. Web traffic and search data reveal changing interests. Feedback surveys signal evolving priorities. Data visualizations like charts make comparisons easy to digest. Seeing change early allows businesses to adapt faster.
2. Buyer behavior insights
Data predicts how customer interests and habits may change ahead. Key insights help craft offerings and messaging that will appeal to audiences in 6 months or a year.
Data shows if current customers are satisfied and likely to buy again or if some may switch to competitors. Models classify the most valuable buyers to focus on. AI looks for others with similar qualities to target next.
Ratings and reviews analysis uncover rising needs that have not been met yet. Web behavior shows shifting priorities. Predictions allow the creation of future products and marketing plans customers will embrace.
3. Risk radar
Risks can blindside any company, but data helps map out hazards on the road ahead. Data simulations model different risk scenarios – from supply chain to cybersecurity, economic conditions, etc. Models estimate the likelihood and impact levels companies may face.
The software runs thousands of “what-if” situations, from floods to strikes, pandemics or hacks. Analysts review the outputs and game plan responses to the biggest threats. Data equips leadership to make strategic decisions or investments to safeguard the future.
4. Smarter supply chains
Global supply chains can have many moving parts that are subject to disruptions. Data illuminates where things might break down across complex distribution networks.
Analytics pinpoint where bottlenecks may form based on growing delays. Algorithms optimize backups and inventory buffers. Tracking transportation conditions in real time enables dynamic route changes as issues arise. Data predictions enhance supply chain resilience.
5. Data-driven innovation
The most successful products meet evolving market needs and priorities ahead of time. Data speeds up innovation cycles to stay ahead.
Analytics parse customer feedback to identify complaints and desires. Web data shows that niche interests are on the rise and present opportunities. Surveys reveal changing preferences early.
Concept test models predict which ideas have the best adoption potential before expensive development. Data aligns research investments with the concepts expected to impact most significantly.
The bottom line
Businesses today are getting a glimpse into the future using data in amazing ways. From spotting trends and understanding customer behavior to managing risks and supply chains, data visualization is key. It turns complex data into clear insights that help companies prepare for what’s coming. By embracing these tools, businesses can stay ahead, innovate faster, and meet the future prepared. This smart use of data visualization is shaping a world where decisions are more informed, risks are managed, and opportunities are seized.


