
6 Diagram Presentation Examples For Better Data Visualization
Data visualization is the act of transforming complex information into clear, actionable insights. There are many ways to effectively present…
Read More

The Ultimate Guide to Creating a Professional Diagram in PowerPoint
Coming up with diagrams that look like a professional did them in PowerPoint isn’t hard. Producing neat and efficient diagrams…
Read More

PowerPoint Install Addins: How to Install and Use Them Effortlessly to Create Engaging Graphs
If you want to make your presentation more interesting, it’s not as simple as just using PowerPoint. PowerPoint install addins…
Read More

Expert Guide to Designing Insightful Venn Diagrams in PowerPoint
Creating Venn diagrams in PowerPoint can seem like a simple task, but crafting truly insightful and visually compelling ones requires…
Read More

Detailed Guide to Crafting Tree Diagrams in PowerPoint
Tree diagrams are fantastic tools for visualizing relationships, processes, and ideas in an organized and easy-to-understand format. Whether you’re brainstorming…
Read More

Beginner’s Guide to Understanding Step Charts in PowerPoint
Step charts are one of the most effective ways to visualize data that changes in stages or steps. Whether you’re…
Read More
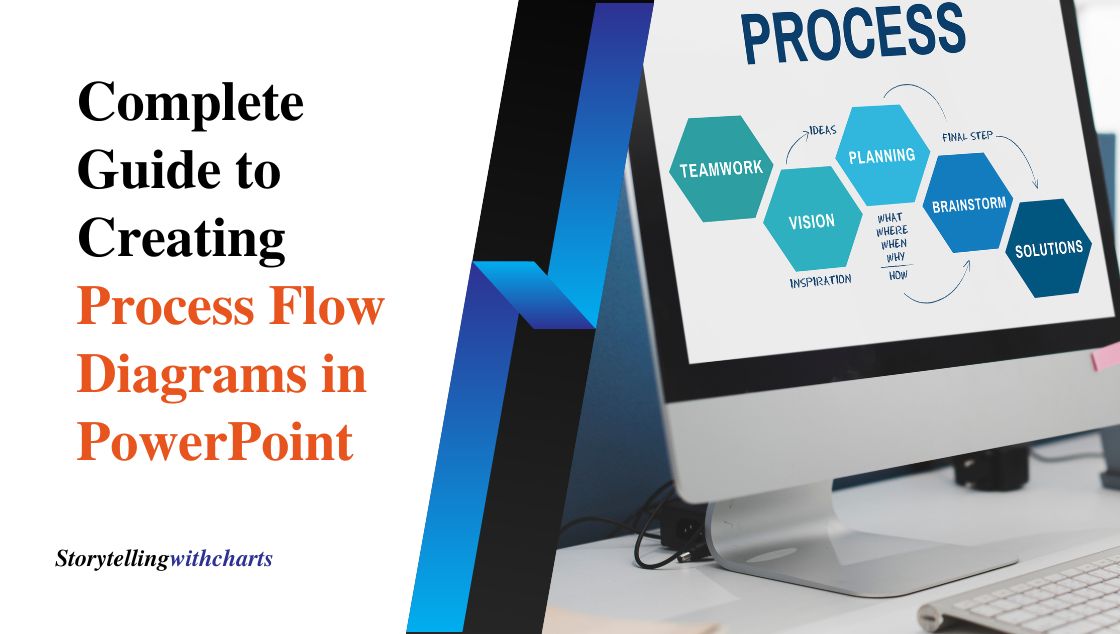
Complete Guide to Creating Process Flow Diagrams in PowerPoint
Process flow diagrams are essential tools for visually representing processes, workflows, or systems. They help understand, analyse, and improve workflows…
Read More
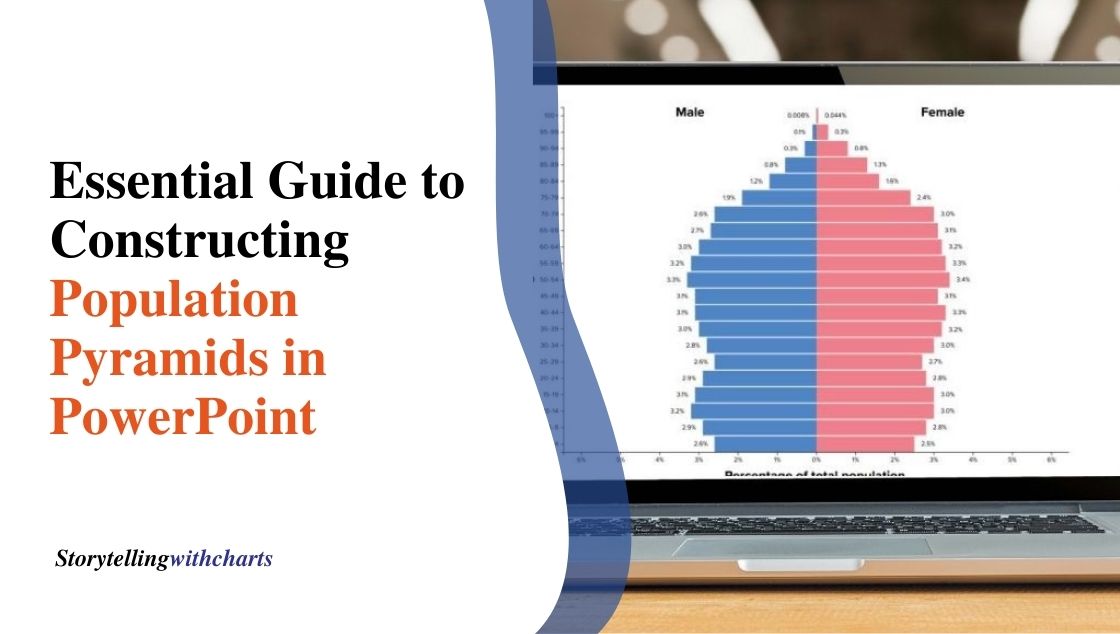
Essential Guide to Constructing Population Pyramids in PowerPoint
Population pyramids are a vital tool in understanding the demographic makeup of a region. Whether you’re a student, researcher, or…
Read More

Beginner’s Guide to Designing Pictographs in PowerPoint
Have you ever needed to visually represent data in a way that’s easy to understand? A pictograph might be the…
Read More