An Overview of Common Line Chart Types and When to Use Them
In the busy world of finance and investing, the ability to interpret market movements and trends through data visualization is invaluable. Among the plethora of chart types available, line charts stand out for their simplicity and effectiveness.
They offer a clear view of how assets, sectors, or indexes have performed over time, making them a staple in the analyst’s toolbox. This blog will dive deep into the types of line charts, their uses, and when it’s best to choose them over other forms of data representation.
Understanding line charts
At their core, line charts are straightforward: they represent an asset’s price changes over a specified period by connecting data points with a line. This method highlights the closing prices of securities, filtering the day-to-day fluctuations into a digestible trend. It’s this simplicity and focus on closing prices that enable traders and investors to cut through the noise, providing a snapshot of a security’s activity over time.
Line chart types
Below are some of the line chart types:
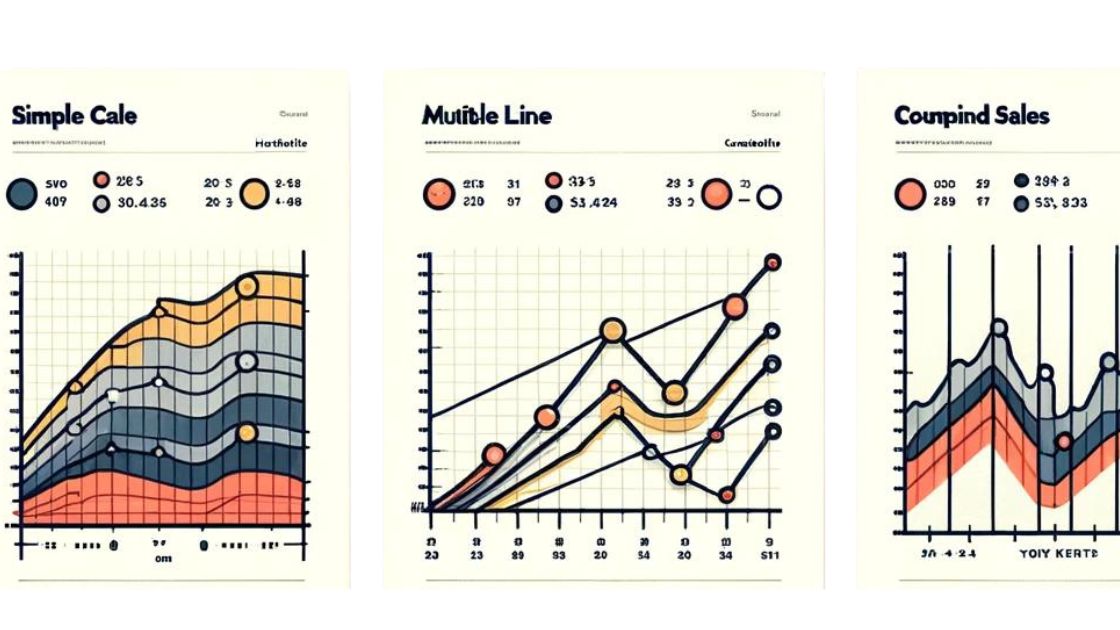
Simple line charts: the basics
The simple line chart is your go-to for tracking a single asset’s price trend over time. With each point representing a closing price and connected across a timeline, it’s the clearest way to visualize performance. Whether assessing a stock’s year-on-year growth or comparing quarterly revenue trends, simple line charts offer a straightforward analysis of price movements.
Multiple line charts: comparison made easy
When the objective shifts to comparing multiple assets or indices, multiple line charts come into play. By plotting various data sets on the same chart, they allow for direct comparison, revealing relative strengths and weaknesses at a glance. This is particularly beneficial when assessing the performance of different sectors or the impact of economic events across markets.
Compound line charts: understanding cumulative effects
For a more layered analysis, compound line charts or stacked line charts, a type of line graph, provide a comprehensive view by stacking different data sets on top of each other. They are instrumental in showing how various factors combine to affect a single outcome over time. By employing types of line graphs, professionals can effectively communicate the complex interplay of multiple variables in a visually appealing and easily digestible manner.
The practicality of line charts in finance
Line charts are more than just simple visual aids; they are powerful analytical tools that serve several key purposes in finance:
- Trend Identification: They excel at highlighting price trends over time, aiding in the strategic decision-making process.
- Performance Comparison: Overlaid line charts enable easy comparison between different financial instruments or economic metrics.
- Simplifying Complex Data: By focusing on end-of-period data, line charts make complex data sets more accessible.
- Historical Analysis: They provide a clear view of how markets or assets have reacted to past events, offering insights for future strategies.
However, it’s essential to recognize when line charts might fall short. For detailed price analysis, comprehensive technical studies, or multifaceted financial analyses, other types of charts, such as bar or candlestick charts, may be more appropriate. Line charts offer a snapshot but lack the detail required for in-depth, intraday trading strategies or complex technical pattern recognition.
Navigating through charts: when to use which?
Choosing the right type of line chart—or deciding to use a different chart type altogether—depends on your analytical needs:
- Use simple line charts for a clear, uncluttered view of a single asset’s price trend over time.
- Opt for multiple line charts when comparing the performance of various assets or indices to identify patterns or divergences.
- Select compound line charts to analyze the cumulative effect of multiple data sets and understand how different factors interact to influence a single outcome.
While line charts are incredibly useful, they are not a one-size-fits-all solution. For granular detail or complex technical analysis, consider alternative visualization tools that better suit your needs.
Conclusion
Line charts are fundamental to financial analysis, offering a straightforward yet powerful means to visualize and compare data over time. By understanding the different line chart types and their specific applications, analysts, traders, and investors can make more informed decisions backed by clear, concise data visualizations.
Whether it’s identifying trends, comparing performances, or simplifying complex data sets, line charts are an essential tool in the financial analyst’s toolkit. Remember, the key to effective analysis lies not just in choosing the right type of chart but in knowing when and how to use it to its full potential.